
by AEC
Which way is the NEM’s energy flowing?
A critical part of the National Electricity Market (NEM) is the six interconnectors that allow electrons to be transported between the states that participate. The NEM began operating in 1998 and was established in response to an Industry Commission report which found that improvements in Australia’s GDP could come, in part, from “the enhancement and extension of the interconnected systems of NSW, ACT, Victoria and South Australia to eventually include, when economically viable, the power systems of Queensland and Tasmania.”[i]
The NEM with its interconnected electricity systems was designed to encourage more competition and help match supply and demand for electrons. The last interconnector to be commissioned was Basslink in 2006 which linked Victoria and Tasmania. Over the years, interconnectors have served their purpose, importing and exporting electricity where required to help meet demand. Regions can be subject to various constraints which can affect the amount of generation available locally and the associated wholesale electricity costs. The challenge is having enough electrons to supply demand at any given time, in any given region. At times of constraints, imported energy from an interconnector can be an important supply of power when local generation is insufficient to meet demand.
Increased penetration of wind in South Australia and the decommissioning of thermal, dispatchable power stations
In its assessment of the upgrade of the Heywood interconnector the Australian Energy Market Operator (AEMO) note that “in the past two years, electricity has been flowing from Victoria to South Australia via the Heywood interconnector about 80% of the time. At times of high South Australian wind generation, electricity tends to flow from South Australia to Victoria”.[ii]
In February 2011, ElectraNet and AEMO published a joint feasibility study that identified NEM benefits from upgrading the Heywood Interconnector, particularly for Victorian and South Australian energy consumers[iii].
Figure 1 shows the net imports in each jurisdiction in the NEM over the past six financial years.
Figure 1: NEM net imports last six years

Source: NEM-Review
Victoria is the most interconnected state in the NEM, with connections to Tasmania, South Australia and New South Wales. New South Wales is connected to Victoria and Queensland, while Queensland, South Australia and Tasmania are only connected to one region each. Interconnectors will transport electricity from one region to another when there is a price differential between regions.
As each region has different customer loads to cater for, the overall value of net imports can be misleading. To add context to this number, table 1 shows net imports as a percentage of total demand in each financial year. If the numbers are negative, it shows that the state is a net exporter for that financial year, and shows the net exports as a percentage of total demand.
Table 1: Net imports as a percentage of total demand
|
|
New South Wales |
Victoria |
Queensland |
South Australia |
Tasmania |
|
2010-11 |
13% |
-8% |
-13% |
4% |
-2% |
|
2011-12 |
11% |
-9% |
-10% |
9% |
3% |
|
2012-13 |
9% |
-5% |
-6% |
11% |
-21% |
|
2013-14 |
8% |
-5% |
-4% |
14% |
-32% |
|
2014-15 |
16% |
-18% |
-11% |
13% |
15% |
|
2015-16 |
10% |
-15% |
-5% |
16% |
6% |
Source: NEM-Review
The impact of the carbon tax on Tasmania’s net imports can be seen in figure 1 and table 1. The increased price placed on baseload generation in Victoria led to Tasmania increasing its exports for 2012-13 and 2013-14 due to the low cost of their surplus generation relative to Victoria. Victoria’s relatively higher cost also led to decreased exports from Victoria and Queensland to New South Wales.
A closer look at South Australia
South Australia has shown a large increase in net exports over the six year period. Increasing from 4 per cent of total demand in 2011-12 to 16 per cent in 2015-16. Figure 2 shows the increase in net imports and the percentage of total demand since 2010-11.
Figure 2: SA net imports and percentage of total demand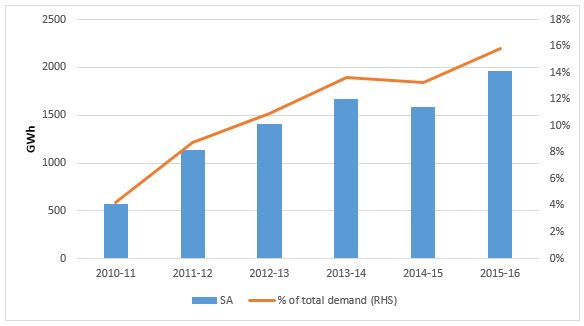
Source: NEM-Review
The interconnector plays a major role in system reliability in South Australia, the continued introduction of wind and solar panels has led to the decreased generation from base-load power stations and the eventual closure of the last coal-fired generation in the state. The result is increased reliance on the Heywood interconnector.
The share of wind in South Australia has increased from 3,038 GWh (22 per cent of total generation) in 2011-12 to 4,316 GWh (38 per cent of total generation) in 2015-16. Over the same period, coal and gas have decreased their share of total generation from 31 to 23 per cent and 48 to 40 per cent respectively. Coal has ceased generation following the closure of the Northern power station leaving gas plants and the interconnector to meet demand when the wind and solar resources are not available. Figure 3 shows the changing generation mix over the last six years.
Figure 3: SA Generation by fuel type 2010-11 to 2015-16

Source: NEM-Review
Previous articles focusing on high prices in South Australia and a brief history into how South Australia has come to be in the position it finds itself in currently can be found in the attached hyperlinks.
This situation was not unforeseen. AEMO has started forecasting minimum demand scenarios for South Australia due to the influx of solar PV, and forecast Low Reserve Condition (LRC) due to the continued closure of firm generation assets across the NEM. LRC is the term used when AEMO considers that a region's reserves fall short of what is required to meet the reliability standard
The forecast for minimum demand and LRC signal different problems facing South Australia at different ends of the spectrum, from having too much generation to not enough. AEMO estimates that minimum demand will be met by solar PV in 2025, while the LRC is forecast to be breached in South Australia in 2019-20..
Both of these issues have a different set of problems which have to be dealt with. Minimum demand being met solely by solar results in issues surrounding maintaining power quality, while the LCR breach is a result of decreased firm generation resulting in forecast lack of supply to meet peak demand.
Greater interconnection in the NEM is being considered as a potential solution, but we are yet to see the strength of any business case.
[i] National Electricity Market A case study in successful microeconomic reform, 13 December 2013, page 3
[ii] The Heywood Interconnector: Overview of the upgrade and current status, August 2015
[iii] ibid
Related Analysis
Certificate schemes – good for governments, but what about customers?
Retailer certificate schemes have been growing in popularity in recent years as a policy mechanism to help deliver the energy transition. The report puts forward some recommendations on how to improve the efficiency of these schemes. It also includes a deeper dive into the Victorian Energy Upgrades program and South Australian Retailer Energy Productivity Scheme.
2025 Election: A tale of two campaigns
The election has been called and the campaigning has started in earnest. With both major parties proposing a markedly different path to deliver the energy transition and to reach net zero, we take a look at what sits beneath the big headlines and analyse how the current Labor Government is tracking towards its targets, and how a potential future Coalition Government might deliver on their commitments.
The return of Trump: What does it mean for Australia’s 2035 target?
Donald Trump’s decisive election win has given him a mandate to enact sweeping policy changes, including in the energy sector, potentially altering the US’s energy landscape. His proposals, which include halting offshore wind projects, withdrawing the US from the Paris Climate Agreement and dismantling the Inflation Reduction Act (IRA), could have a knock-on effect across the globe, as countries try to navigate a path towards net zero. So, what are his policies, and what do they mean for Australia’s own emission reduction targets? We take a look.
Send an email with your question or comment, and include your name and a short message and we'll get back to you shortly.