

by Justine Lovell
Signs of growth: CPI and the renewable job market
Last week the Australian Bureau of Statistics (ABS) released the Consumer Price Index (CPI) results for the March 2018 quarter, and a few days later, reported on renewable energy employment for 2016-17. We take a look at both reports and what the ABS found.
Consumer Price Index
According to the latest figures from the ABS, the CPI rose 0.4 per cent in the three months to March 2018, leaving year-on-year CPI at 1.9 per cent for a second consecutive quarter (Figure 1).
Figure 1
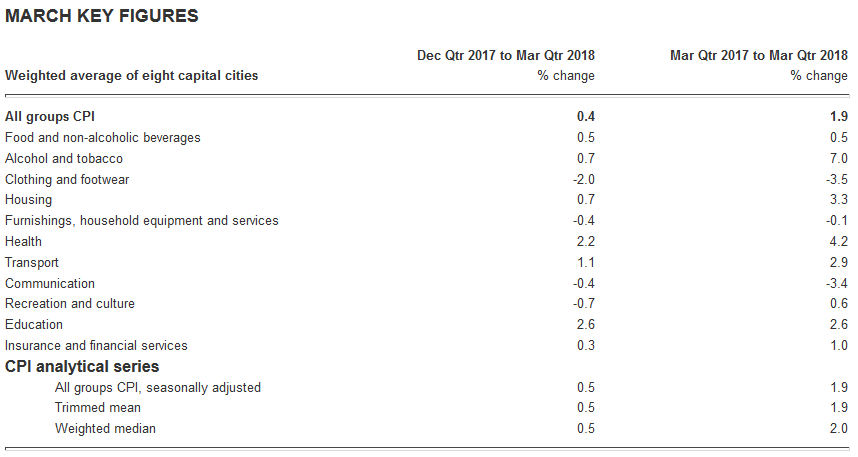 Source: ABS, CPI March Quarter Report 6401.0
Figure 2
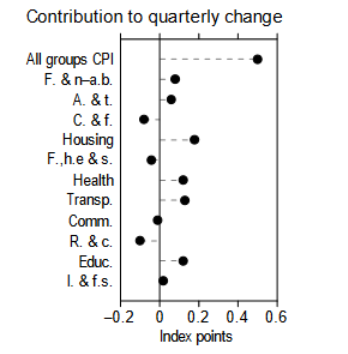
Source: ABS, CPI March Quarter Report 6401.0
Across all groups, CPI rose in seven of the eight capital cities. Melbourne recorded the largest rise (0.9 per cent) and Darwin had no movement. The Household Group – which includes electricity, and gas and other fuels - was the most significant positive contributor to the quarter’s CPI (Figure 2). The ABS notes that the most significant rises in the March quarter include gas and other household fuels (6.0 per cent)[i].
Energy price movement
The Household Group’s CPI increased by 0.7 per cent in the March quarter, with rises in five of the eight capital cities.
Over the last 12 months, the group has increased by 3.3 per cent. The report notes that the main contributor in the March quarter was gas and other household fuels (+6.0 per cent) and electricity (+1.9 per cent), due to increases in wholesale prices.
While the ABS measures the quarterly price movements by metropolitan households across the nation, it does not measure the difference of retail prices between cities. Figure 3 and 4 show the quarter, annual, and five-year change percentage across each capital city for electricity and gas and other household fuels, respectively.
Figure 3: Electricity percentage growth, per city
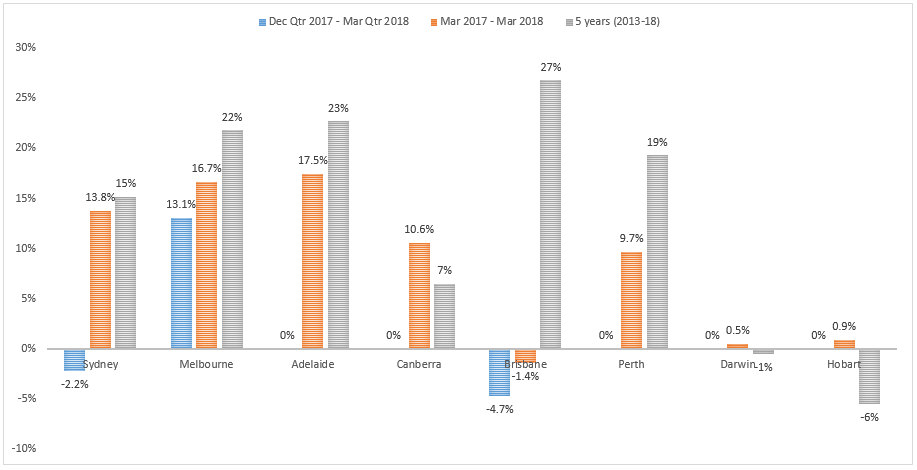 Source: ABS, CPI March Quarter Report 6401.0, Table 9
Figure 4: Gas and other fuels percentage growth, per city
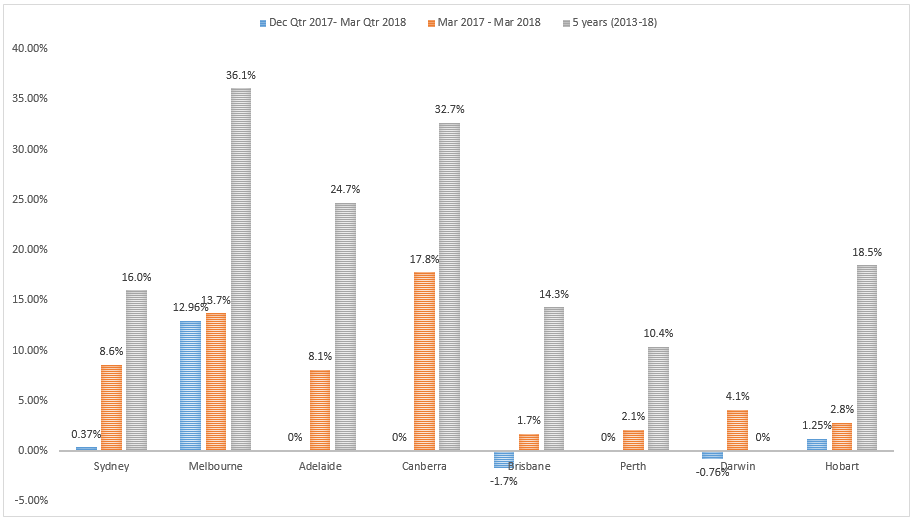 Source: ABS, CPI March Quarter Report 6401.0, Table 9
For the March quarter energy price movement varies across the cities: Sydney's CPI rose by 0.3 per cent across all groups, the ABS states this was partially offset by a 2.2 per cent decrease in electricity.
The main contributor to Melbourne’s total CPI was electricity (+13.1 per cent) and gas and other household fuels (+13 per cent). And while Brisbane CPI rose 0.1 per cent, it was partially offset by a 4.76 per cent fall in electricity. The ABS notes that this fall is due to discounting by energy retailers.
Renewable jobs
While the proportion of energy supplied from renewable sources in Australia remains relatively small (1.7 per cent in 2015-16), last week the ABS announced that renewable energy production jobs grew by 33 per cent (+3680) in 2016-17 - to reach a total of 14,820 full-time equivalent (FTE) positions nationally.
This is the highest level of FTE employment in renewable energy since 2012-13, but still below the peak that was reached in 2011-12 (19,210). And while it’s still a relatively small employment sector, the ABS notes that there is “considerable interest in renewable energy activities and associated employment.”[ii]
The increase in FTE jobs has been primarily driven by construction activity for large scale solar PV systems (+1240) and wind farms (+1370) in Queensland, New South Wales and South Australia, which represent 78 per cent of all renewable energy employment in Australia.
Figure 5: Direct FTE employment in renewable energy activities by state/territory
 Source: ABS, Employment in Renewable Energy 4631.0
Queensland had the largest increase in renewable energy employment gaining an additional 1220 positions, to make a total of 3940 FTE jobs in 2016-17. This reflects the construction of 17 large scale solar farms across the state, and there are claims of the potential for another 40-plus farms[iii].
South Australia experienced a 110 per cent increase – from 710 jobs in 2015-16, to 1490 FTE positions in 2016-17. New South Wales also gained 1160 extra jobs to make a total of 3910 FTE positions in the state. The rises in both states predominately come from construction work on large scale wind generation.
Other states remained relatively steady, compared to the previous year (Figure 5).
Figure 6: Direct FTE employment in renewable energy activities by renewable energy type, Australia
 Source: ABS, Employment in Renewable Energy 4631.0
While the number of roof top solar jobs has declined significantly since 2012, it still remains the largest FTE employer in the renewable energy sector making up 43 per cent in 2016-17 (Figure 6). Across the nation, roof top solar, which includes solar hot water systems, added 860 FTE positions in 2016-17.
The fluctuation of FTE roof top solar jobs is driven by a range of mechanisms, like government policies, taxes, and subsidies. Feed-in tariffs (FiT) have also influenced FTE jobs in the roof top solar industry due to the varying FiT rates over the time frame. From 2011-12 there were reductions in FiT prices, which correspond with the fall in new roof top solar installations. This suggests that the number of FTE jobs in the renewable energy sector are mainly short-term roles.
Employment in wind remained relatively steady from 2009-10 to 2014-15, averaging around 1366 FTE positions. In 2015-16 wind FTE jobs dropped by 37 per cent, but 2016-17 saw a swing back and wind industry jobs peaked at 2140 positions nationally. This is representative of the wind farms currently under construction, shown in Figure 7.
Hydro power stations have remained consistent employers since 2009-10. The amount of FTE jobs in the hydro power sector increased marginally from 1840 in 2015-16, to 2010 positions in 2016-17.
Figure 7: Large-scale renewable energy projects
Projects completed in 2017 |
|||||
Technology |
State |
Developer |
Project |
MW |
Jobs |
|
Wind |
VIC |
RES, GE and Downer |
Ararat Wind Farm |
240 |
165 |
|
Hybrid |
TAS |
Hydro Tasmania |
Flinders Island |
1.1 |
|
|
Wind & Solar |
SA |
EDL |
Coober Pedy |
5 |
|
Projects under construction |
|||||
Technology |
State |
Developer |
Project |
MW |
Jobs |
|
Wind |
SA |
Neoen and Megawatt Capital |
Hornsdale Stage 2 |
100 |
150 |
|
Wind |
SA |
Neoen and Megawatt Capital |
Hornsdale Stage 3 |
109 |
|
|
Wind |
NSW |
Goldwind |
White Rock - Stage 1 |
175 |
300 |
|
Wind |
QLD |
RATCH |
Mt Emerald |
180 |
150 |
|
Wind |
VIC |
Windlab |
Kiata |
30 |
70 |
|
Solar |
WA |
APA |
Emu Downs |
20 |
100 |
|
Solar |
QLD |
Sunshine Coast Council |
Sunshine Coast Solar Farm |
15 |
60 |
|
Solar |
NSW |
New Gullen Range Wind Farm |
Gullen Range Solar Farm |
10 |
70 |
|
Solar |
QLD |
Conergy – Lakeland Solar & Storage P/L |
Lakeland Solar & Storage Project |
10.8 |
60 |
|
Solar |
QLD |
FRV |
Clare Solar Farm |
100 |
200 |
|
Solar |
QLD |
Genex |
Kidston Solar |
50 |
100 |
|
Bagasse |
QLD |
MSF Sugar |
Tableland Sugar Mill |
24 |
80 |
|
Wind |
VIC |
Pacific Hydro |
Yaloak South |
29 |
|
|
Wind |
VIC |
Acciona |
Mt Gellibrand - Stage 1 |
66 |
100 |
|
Wind |
NSW |
Partners Group and CWP Renewables |
Sapphire |
270 |
200 |
|
Solar |
QLD |
Canadian Solar & Scouller Energy |
Normanton Solar Farm |
5 |
20 |
|
Solar |
QLD |
Canadian Solar |
Longreach Solar Farm |
17.4 |
30 |
|
Solar |
QLD |
Canadian Solar |
Oakey 1 Solar Farm |
30 |
50 |
|
Solar |
QLD |
Sun Metals |
Sun Metals Solar Farm |
125 |
210 |
|
Solar |
QLD |
RATCH |
Collinsville |
42 |
120 |
|
Wind |
NSW |
Global Power Generation Australia |
Crookwell 2 |
91 |
80 |
|
Wind |
SA |
Engie |
Willogoleche Wind Farm |
119 |
|
|
Solar |
QLD |
Edify Energy |
Whitsunday Solar Farm |
57.5 |
116 |
|
Solar |
QLD |
|
Hamilton Solar Farm |
57.5 |
|
|
Solar |
QLD |
ESCO Pacific/Palisade |
Ross River |
148 |
150 |
|
Wind |
VIC |
Tilt Renewables |
Salt Creek Wind Farm |
54 |
100 |
|
Solar |
NSW |
Neoen |
Dubbo |
29 |
|
|
Wind & Solar |
QLD |
Windlab |
Kennedy Energy Park |
58 |
100 |
|
Wind |
NSW |
PARF |
Silverton |
200 |
150 |
|
Solar |
SA |
Enel Green Power / Dutch Infrastructure Fund |
Bungala Solar Project |
220 |
350 |
|
Solar |
NSW |
ARENA |
White Rock Solar Farm |
20 |
75 |
|
Solar |
QLD |
Lighthouse Solar |
Hughenden Solar Farm |
22.5 |
|
|
Solar |
SA |
SSE Australia |
Whyalla Solar Farm |
6 |
|
Projects with financial commitment – to start construction in 2017 |
|||||
Technology |
State |
Developer |
Project |
MW |
Jobs |
|
Wind |
VIC |
Goldwind |
Stockyard Hill Wind Farm |
530 |
30 |
|
Solar |
QLD |
FRV |
Lilyvale |
100 |
200 |
|
Solar |
SA |
Snowy Hydro |
Tailem Bend |
100 |
200 |
|
Solar |
NSW |
Neoen |
Griffith, Parkes |
102 |
250 |
|
Solar |
VIC |
Overland Sun Farming |
Yatpool, Iraak, Wemen |
333 |
200 |
|
Solar |
NSW |
First Solar |
Manildra Solar Farm |
42.4 |
|
|
Solar |
SA |
Lyon Group |
Riverland Solar Farm |
330 |
270 |
|
Wind |
NSW |
Infigen Energy |
Bodangora Wind Farm |
113.2 |
120 |
|
Solar |
QLD |
RES |
Emerald Solar Park |
68 |
150 |
|
Solar |
QLD |
Canadian Solar |
Oakey 2 SF |
70 |
100 |
|
Wind |
SA |
Nexif Energy |
Lincoln Gap Wind Farm - Stage 1 |
126 |
110 |
|
Solar |
QLD |
APA Group |
Darling Downs |
106.8 |
200 |
|
Wind |
QLD |
AGL/PARF |
Coopers Gap Wind Farm |
453 |
200 |
Source: Clean Energy Council
[i] Consumer Price Index Media Release, Australia, March 2018
[ii] ABS media release, Renewable energy jobs up by a third, April 2018
[iii] Sunshine Coast Daily, Solar Farm Boom, March 2018
Related Analysis
Certificate schemes – good for governments, but what about customers?
Retailer certificate schemes have been growing in popularity in recent years as a policy mechanism to help deliver the energy transition. The report puts forward some recommendations on how to improve the efficiency of these schemes. It also includes a deeper dive into the Victorian Energy Upgrades program and South Australian Retailer Energy Productivity Scheme.
2025 Election: A tale of two campaigns
The election has been called and the campaigning has started in earnest. With both major parties proposing a markedly different path to deliver the energy transition and to reach net zero, we take a look at what sits beneath the big headlines and analyse how the current Labor Government is tracking towards its targets, and how a potential future Coalition Government might deliver on their commitments.
The return of Trump: What does it mean for Australia’s 2035 target?
Donald Trump’s decisive election win has given him a mandate to enact sweeping policy changes, including in the energy sector, potentially altering the US’s energy landscape. His proposals, which include halting offshore wind projects, withdrawing the US from the Paris Climate Agreement and dismantling the Inflation Reduction Act (IRA), could have a knock-on effect across the globe, as countries try to navigate a path towards net zero. So, what are his policies, and what do they mean for Australia’s own emission reduction targets? We take a look.
Send an email with your question or comment, and include your name and a short message and we'll get back to you shortly.