

by Nick Cannard
High price events: A history
The number of high priced events have been under the spotlight recently with commentary about the impact of renewable generation on prices, including suggestions that renewables have helped dampen high prices in the National Electricity Market since 2010-11. We take a look at the main factors contributing to historic high price events and more recently, the factors that have led to recent high prices in South Australia and Queensland. Figure 1 shows the number of times spot price spikes exceeded $5000/MWh in each region since 2007-08.
Figure 1: Number of high prices events (above $5000/MWh)
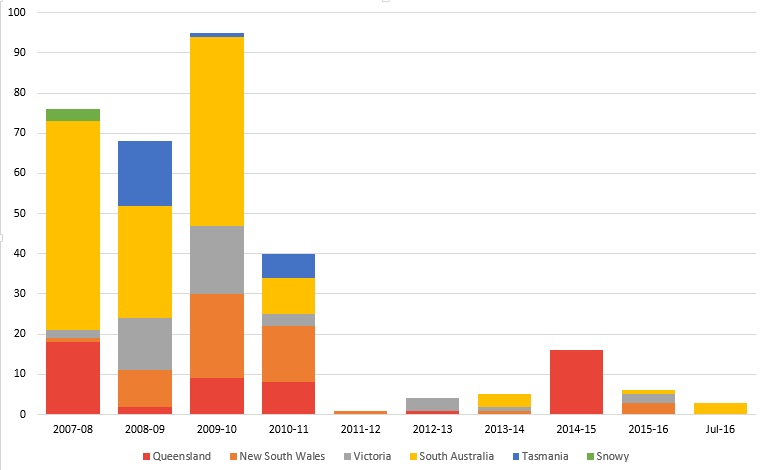
Source: NEM-REVIEW
As highlighted in figure 1, the price spikes above $5000/MWh have declined significantly since 2010-11. Queensland saw large price spikes in the summer of 2014-15 and, more recently, South Australia in the last month. The drop in the number of high priced events can be attributed to a decline in demand from 2008-09 and increased surplus generation. Figure 2 highlights the drop in demand since its peak in 2008-09. All high price events since 2007-08 can be found in Appendix 1.
Figure 2: NEM demand
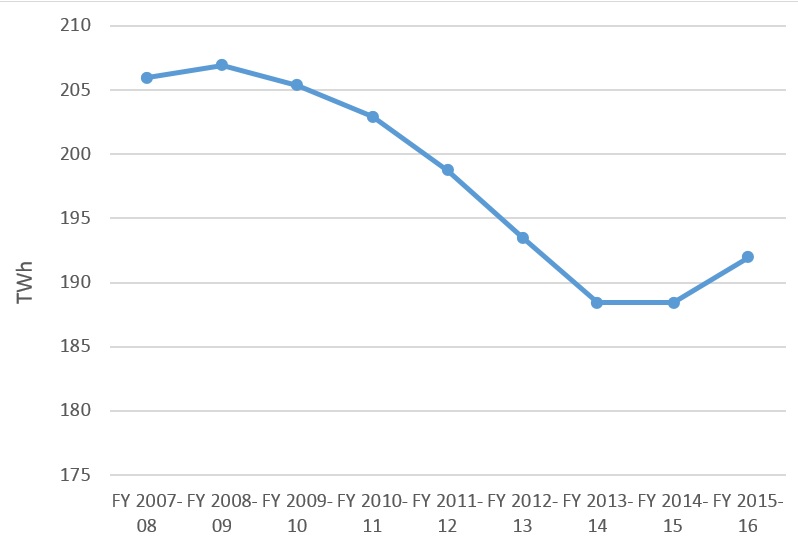
Source: NEM-Review
Demand grew fairly consistently until 2008-09. The growing number of air conditioners and increased number of residential households meant that peak demand grew faster than overall demand. The effects of increased energy efficiency, decreased industrial demand and the uptake of residential solar panels resulted in demand decreasing from 207 TWh in 2008-09 to 188 TWh in 2014-15.
Over the same period, while demand was declining, generation capacity continued to grow due to the help of federal and state schemes. The Renewable Energy Target (RET) allows eligible participants a fluctuating price for each MWh of renewable energy which is generated called a Large-scale Generation Certificate (LGC). The average price of LGCs last week was $85.50. State and Territory-based schemes, such as the ACT renewable energy target, offer a different incentive. In the case of the ACT's reverse auction, a guaranteed price for each MWh generated is paid to the winning bidder. Figure 3 shows the impact these schemes have had on South Australia’s electricity supply where much of the investment in renewable energy (and wind in particular) has occurred.
Figure 3: Installed wind capacity in South Australia (project name – commissioned date)
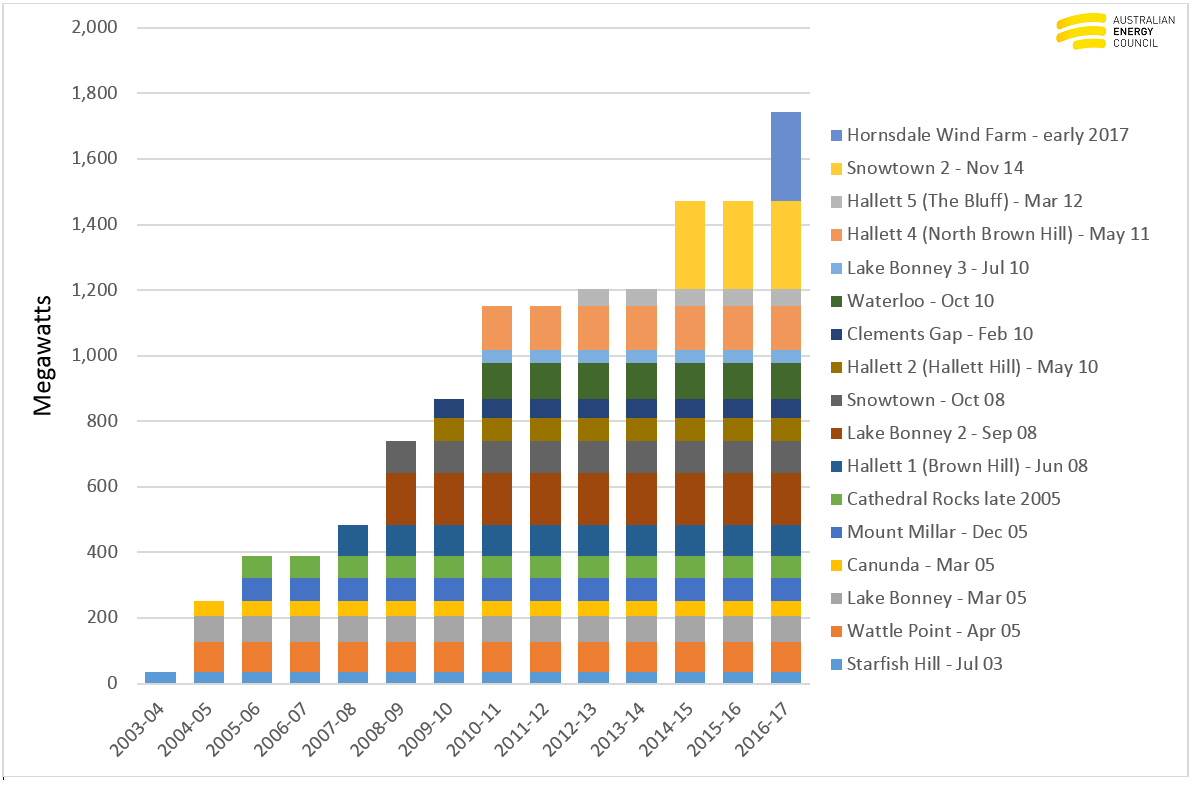
Source: Electricity Gas Australia, Australian Energy Council analysis
Price spikes (2007-08 to 2010-11)
Each event over $5,000/MWh is analysed by the Australian Energy Regulator and its assessments can be found here.
Below we take a look at the cause of some high priced events across the NEM. Figure 4 shows each region of the NEM and the years where the number of high priced events peaked.
Figure 4: Highest number of events in a financial year for each region in the NEM
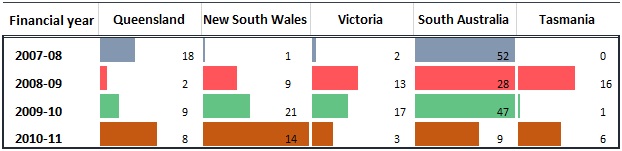
Source: NEM-Review
During the first quarter of 2008, the electricity spot price in South Australia exceeded $5000/MWh on 51 occasions. An initial AER report into the events of January and February 2008 found that the high prices were caused by a combination of high demand, generator bidding and transmission constraints[i].
In the period 2007-2008 to 2009-2010, South Australia had the most of trading intervals exceeding $5,000//MWh. In 2009-2010 the number of high priced events reached 47 for the state.
Victoria and South Australia often coincide with peak electricity use due to similar weather patterns across those two states. In 2009-10, the majority of Victoria’s pricing events occurred at the same time as South Australia’s on 11 January 2010. In Melbourne, the temperature on 11 January reached 42.8 degrees, while South Australia reached 42.8 degrees. The average temperature in Victoria and South Australia for the five days leading up to 11 January was 34.6 degrees and 40.4 degrees respectively. South Australia relies solely on the interconnectors with Victoria for its electricity imports. Any outages, trips or constraints can have major repercussions for prices. Network constraints did occur during this period leading to decreased imports from New South Wales into Victoria and Victoria into South Australia, which ultimately lead to higher prices[ii].
Queensland and South Australia’s recent spikes
The majority of Queensland’s large price spikes in 2014-15 occurred during summer where Queensland sweltered through a heatwave leading some analysts to think a new LNG plant had been switched on[iii]. Instead, we later learnt that Queenslanders were leaving air conditioners on to deal with the extreme heat. During times of high demand, supply and demand are tighter than usual and prices become volatile during times of constraints. December 17 saw seven periods where spot prices were above $5,000/MWh. Temperatures reached 38.5 degrees and demand reached 8,445 MW.
Recent analysis on South Australia’s high prices can be found on the Australian Energy Council website. Interconnector constraints, high gas prices, the decommissioning of Northern, a cold snap and wind availability have all played a role in the recent high priced events in South Australia.
Appendix 1
|
|
Spot Price $/MWh * |
> $5000 |
||||
|
|
Settlement Date |
NSW |
QLD |
SA |
VIC |
TAS |
|
FY 2007-08 |
22/10/2007 10:00 |
$ 7,858.07 |
|
|
|
|
|
|
4/11/2007 12:00 |
$ 5,723.07 |
|
|||
|
|
4/11/2007 12:30 |
$ 6,000.52 |
|
|||
|
|
31/12/2007 13:00 |
$ 5,057.04 |
|
|||
|
|
4/01/2008 15:00 |
$ 8,353.99 |
|
|||
|
|
4/01/2008 15:30 |
$ 9,950.37 |
|
|||
|
|
4/01/2008 16:00 |
$ 9,950.32 |
|
|||
|
|
4/01/2008 16:30 |
$ 9,949.94 |
|
|||
|
|
4/01/2008 17:00 |
$ 9,948.25 |
|
|||
|
|
10/01/2008 14:30 |
$ 9,999.72 |
|
|||
|
|
10/01/2008 15:00 |
$ 9,999.72 |
|
|||
|
|
10/01/2008 15:30 |
$ 9,999.72 |
|
|||
|
|
10/01/2008 16:00 |
$ 9,999.72 |
|
|||
|
|
10/01/2008 16:30 |
$ 9,999.72 |
|
|||
|
|
10/01/2008 17:00 |
$ 9,999.72 |
|
|||
|
|
10/01/2008 17:30 |
$ 9,999.72 |
|
|||
|
|
30/01/2008 16:30 |
$ 9,920.99 |
|
|||
|
|
7/02/2008 16:30 |
$ 6,622.24 |
|
|||
|
|
18/02/2008 13:00 |
$ 9,999.72 |
|
|||
|
|
18/02/2008 13:30 |
$ 9,999.59 |
|
|||
|
|
18/02/2008 14:00 |
$ 9,999.72 |
|
|||
|
|
18/02/2008 14:30 |
$ 9,999.72 |
|
|||
|
|
18/02/2008 15:00 |
$ 9,999.72 |
|
|||
|
|
18/02/2008 15:30 |
$ 9,999.72 |
|
|||
|
|
18/02/2008 16:00 |
$ 9,999.72 |
|
|||
|
|
18/02/2008 16:30 |
$ 9,999.72 |
|
|||
|
|
18/02/2008 17:00 |
$ 9,999.72 |
|
|||
|
|
18/02/2008 17:30 |
$ 9,999.72 |
|
|||
|
|
18/02/2008 18:00 |
$ 9,999.72 |
|
|||
|
|
18/02/2008 18:30 |
$ 9,991.56 |
|
|||
|
|
19/02/2008 18:00 |
$ 6,087.21 |
|
|||
|
|
22/02/2008 13:00 |
$ 7,169.02 |
|
|||
|
|
22/02/2008 13:30 |
$ 6,347.90 |
|
|||
|
|
22/02/2008 14:00 |
$ 8,811.93 |
|
|||
|
|
22/02/2008 14:30 |
$ 8,743.92 |
|
|||
|
|
22/02/2008 15:00 |
$ 6,421.40 |
|
|||
|
|
22/02/2008 15:30 |
$ 9,561.42 |
|
|||
|
|
22/02/2008 16:00 |
$ 9,494.95 |
|
|||
|
|
23/02/2008 12:30 |
$ 8,177.45 |
|
|||
|
|
23/02/2008 13:00 |
$ 8,471.44 |
|
|||
|
|
23/02/2008 13:30 |
$ 8,811.24 |
|
|||
|
|
23/02/2008 14:00 |
$ 9,153.61 |
|
|||
|
|
23/02/2008 14:30 |
$ 7,065.39 |
|
|||
|
|
23/02/2008 15:00 |
$ 7,065.33 |
|
|||
|
|
23/02/2008 15:30 |
$ 6,000.01 |
|
|||
|
|
5/03/2008 15:00 |
$ 9,252.07 |
|
|||
|
|
5/03/2008 15:30 |
$ 9,949.52 |
|
|||
|
|
5/03/2008 16:00 |
$ 9,975.23 |
|
|||
|
|
5/03/2008 16:30 |
$ 9,967.00 |
|
|||
|
|
5/03/2008 17:00 |
$ 9,950.40 |
|
|||
|
|
5/03/2008 17:30 |
$ 8,299.86 |
|
|||
|
|
6/03/2008 15:00 |
$ 9,717.35 |
|
|||
|
|
6/03/2008 15:30 |
$ 9,950.42 |
|
|||
|
|
6/03/2008 16:00 |
$ 9,950.75 |
|
|||
|
|
6/03/2008 16:30 |
$ 9,950.66 |
|
|||
|
|
6/03/2008 17:00 |
$ 9,950.25 |
|
|||
|
|
7/03/2008 15:30 |
$ 6,979.01 |
|
|||
|
|
7/03/2008 16:00 |
$ 7,004.20 |
|
|||
|
|
12/03/2008 16:30 |
$ 9,999.72 |
|
|||
|
|
12/03/2008 17:00 |
$ 9,999.72 |
|
|||
|
|
12/03/2008 17:30 |
$ 9,999.72 |
|
|||
|
|
12/03/2008 18:00 |
$ 9,999.72 |
|
|||
|
|
13/03/2008 14:30 |
$ 8,352.48 |
|
|||
|
|
13/03/2008 15:00 |
$ 9,999.72 |
|
|||
|
|
13/03/2008 15:30 |
$ 9,999.72 |
|
|||
|
|
13/03/2008 16:00 |
$ 9,999.72 |
|
|||
|
|
13/03/2008 16:30 |
$ 9,999.72 |
|
|||
|
|
13/03/2008 17:00 |
$ 9,999.72 |
|
|||
|
|
13/03/2008 17:30 |
$ 9,999.72 |
|
|||
|
|
17/03/2008 16:00 |
$ 7,570.31 |
$ 7,810.96 |
|
||
|
|
17/03/2008 16:30 |
$ 7,894.49 |
$ 7,910.08 |
|
||
|
FY 2008-09 |
23/07/2008 18:30 |
$ 8,454.96 |
$ 8,058.07 |
$ 8,032.50 |
$ 8,766.23 |
|
|
|
31/10/2008 12:00 |
$ 6,794.80 |
|
|||
|
|
31/10/2008 12:30 |
$ 6,861.91 |
|
|||
|
|
31/10/2008 13:00 |
$ 10,000.00 |
|
|||
|
|
31/10/2008 13:30 |
$ 10,000.00 |
|
|||
|
|
31/10/2008 14:30 |
$ 6,787.37 |
|
|||
|
|
31/10/2008 15:00 |
$ 10,000.00 |
|
|||
|
|
31/10/2008 15:30 |
$ 5,408.77 |
|
|||
|
|
20/11/2008 14:30 |
$ 5,061.39 |
|
|||
|
|
13/01/2009 14:00 |
$ 7,783.73 |
|
|||
|
|
13/01/2009 14:30 |
$ 9,799.47 |
|
|||
|
|
13/01/2009 15:00 |
$ 9,399.92 |
|
|||
|
|
13/01/2009 15:30 |
$ 9,998.93 |
|
|||
|
|
13/01/2009 16:00 |
$ 8,550.72 |
|
|||
|
|
13/01/2009 16:30 |
$ 9,999.09 |
|
|||
|
|
13/01/2009 17:00 |
$ 9,799.35 |
|
|||
|
|
13/01/2009 17:30 |
$ 9,000.47 |
|
|||
|
|
15/01/2009 14:00 |
$ 5,210.57 |
|
|||
|
|
19/01/2009 12:30 |
$ 5,050.38 |
|
|||
|
|
19/01/2009 14:00 |
$ 9,999.68 |
|
|||
|
|
19/01/2009 14:30 |
$ 8,499.68 |
|
|||
|
|
19/01/2009 15:00 |
$ 8,750.12 |
|
|||
|
|
19/01/2009 15:30 |
$ 9,999.77 |
|
|||
|
|
19/01/2009 16:00 |
$ 9,999.77 |
|
|||
|
|
28/01/2009 15:00 |
$ 9,999.77 |
|
|||
|
|
28/01/2009 15:30 |
$ 9,999.77 |
$ 6,035.89 |
|
||
|
|
28/01/2009 16:00 |
$ 9,999.77 |
|
|||
|
|
28/01/2009 16:30 |
$ 9,999.77 |
|
|||
|
|
28/01/2009 17:00 |
$ 9,999.77 |
|
|||
|
|
29/01/2009 8:30 |
$ 8,266.44 |
$ 9,511.49 |
|
||
|
|
29/01/2009 9:00 |
$ 9,398.05 |
$ 10,000.00 |
|
||
|
|
29/01/2009 12:00 |
$ 5,042.02 |
$ 5,098.65 |
|
||
|
|
29/01/2009 12:30 |
$ 5,594.24 |
$ 5,885.40 |
|
||
|
|
29/01/2009 13:00 |
$ 9,897.98 |
|
|||
|
|
29/01/2009 13:30 |
$ 9,584.80 |
|
|||
|
|
29/01/2009 14:00 |
$ 9,999.92 |
$ 9,357.65 |
|
||
|
|
29/01/2009 14:30 |
$ 9,470.63 |
$ 9,500.84 |
|
||
|
|
29/01/2009 15:00 |
$ 9,733.23 |
$ 10,000.00 |
|
||
|
|
29/01/2009 15:30 |
$ 8,383.34 |
|
|||
|
|
29/01/2009 16:00 |
$ 6,872.23 |
|
|||
|
|
29/01/2009 19:00 |
$ 6,778.32 |
||||
|
|
30/01/2009 10:00 |
$ 5,442.84 |
||||
|
|
30/01/2009 11:00 |
$ 6,880.22 |
||||
|
|
31/03/2009 17:00 |
$ 5,022.35 |
|
|||
|
|
1/06/2009 10:00 |
$ 9,159.39 |
||||
|
|
10/06/2009 9:30 |
$ 6,211.93 |
||||
|
|
11/06/2009 9:30 |
$ 7,576.61 |
||||
|
|
12/06/2009 9:30 |
$ 9,992.30 |
||||
|
|
15/06/2009 17:00 |
$ 8,373.59 |
||||
|
|
15/06/2009 18:00 |
$ 9,992.25 |
||||
|
|
16/06/2009 8:30 |
$ 6,874.97 |
||||
|
|
16/06/2009 9:30 |
$ 9,992.29 |
||||
|
|
16/06/2009 10:30 |
$ 5,103.78 |
||||
|
|
16/06/2009 17:00 |
$ 9,992.20 |
||||
|
|
19/06/2009 8:30 |
$ 9,992.30 |
||||
|
|
19/06/2009 9:30 |
$ 9,160.30 |
||||
|
|
19/06/2009 10:30 |
$ 5,000.30
|
||||
|
FY 2009-10 |
2/11/2009 14:00 |
|
|
$ 9,999.74 |
|
|
|
|
3/11/2009 16:00 |
$ 6,337.10 |
$ 5,706.28 |
|
||
|
|
10/11/2009 16:00 |
$ 9,999.77 |
|
|||
|
|
10/11/2009 16:30 |
$ 9,999.77 |
|
|||
|
|
10/11/2009 17:00 |
$ 9,999.69 |
|
|||
|
|
11/11/2009 15:30 |
$ 5,062.11 |
|
|||
|
|
11/11/2009 16:00 |
$ 9,999.77 |
|
|||
|
|
11/11/2009 16:30 |
$ 9,999.77 |
|
|||
|
|
11/11/2009 17:00 |
$ 9,999.77 |
|
|||
|
|
11/11/2009 17:30 |
$ 9,999.71 |
|
|||
|
|
12/11/2009 15:30 |
$ 9,999.77 |
|
|||
|
|
12/11/2009 16:00 |
$ 9,999.77 |
|
|||
|
|
12/11/2009 16:30 |
$ 9,999.77 |
|
|||
|
|
12/11/2009 17:00 |
$ 9,999.77 |
|
|||
|
|
13/11/2009 16:00 |
$ 9,999.77 |
|
|||
|
|
13/11/2009 16:30 |
$ 9,999.77 |
|
|||
|
|
19/11/2009 14:30 |
$ 6,777.81 |
|
|||
|
|
19/11/2009 15:00 |
$ 8,396.44 |
|
|||
|
|
19/11/2009 15:30 |
$ 9,999.65 |
|
|||
|
|
19/11/2009 16:00 |
$ 9,999.77 |
|
|||
|
|
19/11/2009 16:30 |
$ 9,999.77 |
|
|||
|
|
19/11/2009 17:00 |
$ 9,999.77 |
|
|||
|
|
19/11/2009 17:30 |
$ 9,998.40 |
|
|||
|
|
19/11/2009 18:00 |
$ 6,999.21 |
|
|||
|
|
20/11/2009 10:00 |
$ 6,696.65 |
|
|||
|
|
20/11/2009 11:00 |
$ 8,664.47 |
|
|||
|
|
20/11/2009 11:30 |
$ 6,728.98 |
|
|||
|
|
20/11/2009 12:30 |
$ 7,051.49 |
$ 5,927.79 |
|
||
|
|
20/11/2009 13:00 |
$ 9,283.95 |
$ 8,388.30 |
|
||
|
|
20/11/2009 13:30 |
$ 6,204.34 |
$ 5,563.64 |
|
||
|
|
20/11/2009 15:30 |
$ 5,152.13 |
|
|||
|
|
27/11/2009 15:30 |
$ 8,932.89 |
$ 7,527.19 |
|
||
|
|
27/11/2009 16:00 |
$ 5,461.60 |
|
|||
|
|
7/12/2009 12:00 |
$ 7,714.89 |
|
|||
|
|
7/12/2009 13:00 |
$ 5,023.77 |
|
|||
|
|
7/12/2009 14:00 |
$ 9,059.53 |
|
|||
|
|
7/12/2009 14:30 |
$ 9,175.60 |
|
|||
|
|
7/12/2009 15:00 |
$ 9,134.05 |
|
|||
|
|
7/12/2009 15:30 |
$ 6,308.41 |
|
|||
|
|
17/12/2009 11:00 |
$ 5,546.80 |
|
|||
|
|
17/12/2009 15:00 |
$ 8,703.08 |
|
|||
|
|
17/12/2009 16:00 |
$ 5,467.81 |
|
|||
|
|
8/01/2010 15:30 |
$ 9,999.71 |
|
|||
|
|
8/01/2010 16:00 |
$ 9,999.71 |
|
|||
|
|
8/01/2010 16:30 |
$ 9,999.71 |
|
|||
|
|
11/01/2010 13:30 |
$ 5,551.71 |
|
|||
|
|
11/01/2010 14:00 |
$ 8,524.97 |
|
|||
|
|
11/01/2010 14:30 |
$ 7,618.06 |
$ 6,839.82 |
$ 36.34 |
||
|
|
11/01/2010 15:00 |
$ 9,100.77 |
$ 9,195.56 |
$ 36.34 |
||
|
|
11/01/2010 15:30 |
$ 9,100.77 |
$ 9,194.09 |
|
||
|
|
11/01/2010 16:00 |
$ 9,115.57 |
$ 9,200.50 |
|
||
|
|
11/01/2010 16:30 |
$ 9,100.77 |
$ 8,853.89 |
|
||
|
|
11/01/2010 17:30 |
$ 6,099.82 |
$ 5,943.46 |
|
||
|
|
18/01/2010 14:30 |
$ 9,207.97 |
|
|||
|
|
18/01/2010 15:00 |
$ 9,124.70 |
|
|||
|
|
18/01/2010 15:30 |
$ 6,716.67 |
|
|||
|
|
18/01/2010 16:00 |
$ 5,429.84 |
|
|||
|
|
4/02/2010 12:00 |
$ 5,540.90 |
|
|||
|
|
8/02/2010 16:00 |
$ 8,430.79 |
$ 6,481.89 |
|
||
|
|
8/02/2010 16:30 |
$ 6,719.05 |
$ 6,368.41 |
|
||
|
|
9/02/2010 13:30 |
$ 6,833.20 |
|
|||
|
|
9/02/2010 14:00 |
$ 9,999.76 |
|
|||
|
|
9/02/2010 14:30 |
$ 9,999.77 |
|
|||
|
|
9/02/2010 15:00 |
$ 8,430.74 |
|
|||
|
|
9/02/2010 15:30 |
$ 9,999.77 |
|
|||
|
|
9/02/2010 16:00 |
$ 9,999.77 |
$ 6,246.55 |
|
||
|
|
9/02/2010 16:30 |
$ 9,999.92 |
$ 7,847.30 |
|
||
|
|
9/02/2010 17:00 |
$ 9,705.76 |
|
|||
|
|
9/02/2010 17:30 |
$ 8,764.23 |
|
|||
|
|
10/02/2010 14:30 |
$ 8,823.77 |
|
|||
|
|
10/02/2010 15:00 |
$ 6,786.97 |
|
|||
|
|
22/02/2010 16:00 |
$ 8,345.79 |
|
|||
|
|
22/04/2010 12:30 |
$ 5,022.42 |
|
|||
|
|
22/04/2010 13:00 |
$ 9,997.78 |
|
|||
|
|
22/04/2010 13:30 |
$ 5,003.82 |
|
|||
|
|
22/04/2010 14:30 |
$ 8,382.58 |
|
|||
|
|
22/04/2010 15:00 |
$ 9,998.59 |
|
|||
|
|
22/04/2010 15:30 |
$ 9,997.70 |
|
|||
|
|
22/04/2010 16:00 |
$ 9,998.23 |
|
|||
|
|
22/05/2010 18:30 |
$ 6,750.00 |
||||
|
FY 2010-11 |
7/08/2010 9:00 |
|
|
|
|
$ 5,720.21 |
|
|
7/08/2010 18:30 |
$ 12,400.26 |
||||
|
|
8/08/2010 18:00 |
$ 12,400.08 |
||||
|
|
8/08/2010 18:30 |
$ 12,400.08 |
||||
|
|
8/08/2010 19:30 |
$ 8,300.09 |
||||
|
|
10/08/2010 8:30 |
$ 6,266.50 |
|
|||
|
|
10/08/2010 9:00 |
$ 5,755.45 |
|
|||
|
|
19/11/2010 7:00 |
$ 12,400.00 |
||||
|
|
31/01/2011 14:00 |
$ 12,099.23 |
|
|||
|
|
31/01/2011 14:30 |
$ 11,999.38 |
|
|||
|
|
31/01/2011 15:00 |
$ 12,199.53 |
|
|||
|
|
31/01/2011 15:30 |
$ 12,198.70 |
$ 9,596.53 |
|
||
|
|
31/01/2011 16:00 |
$ 6,019.97 |
$ 12,132.53 |
|
||
|
|
31/01/2011 16:30 |
$ 12,182.70 |
|
|||
|
|
31/01/2011 17:00 |
$ 12,066.03 |
|
|||
|
|
31/01/2011 17:30 |
$ 12,081.95 |
|
|||
|
|
31/01/2011 18:00 |
$ 9,020.63 |
|
|||
|
|
1/02/2011 13:30 |
$ 5,039.89 |
$ 5,332.68 |
|
||
|
|
1/02/2011 14:00 |
$ 5,077.61 |
|
|||
|
|
1/02/2011 15:00 |
$ 7,079.65 |
|
|||
|
|
1/02/2011 15:30 |
$ 12,072.50 |
$ 6,109.80 |
|
||
|
|
1/02/2011 16:00 |
$ 12,136.17 |
$ 7,349.99 |
|
||
|
|
1/02/2011 16:30 |
$ 9,544.52 |
$ 5,831.57 |
|
||
|
|
2/02/2011 14:00 |
$ 5,581.95 |
|
|||
|
|
2/02/2011 14:30 |
$ 5,831.21 |
$ 5,198.13 |
|
||
|
|
2/02/2011 15:00 |
$ 9,173.00 |
$ 8,218.62 |
|
||
|
|
2/02/2011 15:30 |
$ 10,417.07 |
$ 8,088.42 |
|
||
|
|
2/02/2011 16:00 |
$ 10,243.51 |
$ 9,043.67 |
|
||
|
|
2/02/2011 16:30 |
$ 8,773.39 |
$ 8,088.38 |
|
||
|
FY 2011-12 |
9/11/2011 15:30 |
$ 6,497.76 |
|
|
|
|
|
FY 2012-13 |
29/11/2012 16:00 |
|
|
|
$ 8,955.53 |
|
|
|
29/11/2012 16:30 |
$ 9,974.42 |
|
|||
|
|
29/11/2012 17:00 |
$ 8,218.90 |
|
|||
|
|
29/01/2013 17:00 |
$ 6,298.63 |
$ 45.79 |
$ 44.51 |
|
|
|
FY 2013-14 |
19/12/2013 16:00 |
|
|
$ 10,627.00 |
|
|
|
|
19/12/2013 16:30 |
$ 5,639.52 |
|
|||
|
|
20/12/2013 13:30 |
$ 7,696.44 |
|
|||
|
|
15/01/2014 16:00 |
$ 6,213.38 |
$ 5,972.27 |
|
||
|
FY 2014-15 |
17/12/2014 14:00 |
|
$ 6,736.60 |
|
|
|
|
|
17/12/2014 14:30 |
$ 8,979.62 |
|
|||
|
|
17/12/2014 15:30 |
$ 10,060.33 |
|
|||
|
|
17/12/2014 16:00 |
$ 8,992.75 |
|
|||
|
|
17/12/2014 16:30 |
$ 13,499.00 |
|
|||
|
|
17/12/2014 17:00 |
$ 13,499.00 |
|
|||
|
|
17/12/2014 17:30 |
$ 8,989.31 |
|
|||
|
|
15/01/2015 17:00 |
$ 12,950.00 |
|
|||
|
|
15/01/2015 18:00 |
$ 6,493.30 |
|
|||
|
|
15/01/2015 19:00 |
$ 5,075.99 |
|
|||
|
|
18/01/2015 17:00 |
$ 6,625.75 |
|
|||
|
|
5/03/2015 16:30 |
$ 12,957.50 |
|
|||
|
|
5/03/2015 17:00 |
$ 9,382.83 |
|
|||
|
|
5/03/2015 17:30 |
$ 13,166.27 |
|
|||
|
|
5/03/2015 18:00 |
$ 8,673.29 |
|
|||
|
|
5/03/2015 19:00 |
$ 11,024.50 |
|
|||
|
FY 2015-16 |
23/09/2015 18:30 |
$ 13,419.89 |
|
|
|
|
|
|
23/09/2015 19:00 |
$ 6,717.38 |
|
|||
|
|
13/01/2016 15:30 |
$ 9,137.03 |
|
|||
|
|
13/01/2016 16:00 |
$ 5,173.04 |
$ 7,477.35 |
|
||
|
|
14/01/2016 14:00 |
$ 5,022.74 |
$ 309.27 |
$ 19.57 |
$ 20.32 |
$ 95.29 |
|
FY 2016-17 |
7/07/2016 19:30 |
|
|
$ 8,897.80 |
|
|
|
|
13/07/2016 6:30 |
$ 7,068.49 |
|
|||
|
|
14/07/2016 18:30 |
|
|
$ 6,917.55 |
|
|
[i] State of the Energy Market 2008, AER, page 89
[ii] AER, “Electricity spot prices above $5000/MWh 11 January 2010 South Australia and Victoria”, https://www.aer.gov.au/system/files/5000Report_11%20January%202010%20-%20SA%20and%20VIC.pdf
[iii] Wattclarity, “Mysterious jump in Queensland demand”, http://www.wattclarity.com.au/2015/01/mysterious-jump-in-queensland-demand/
Related Analysis
Certificate schemes – good for governments, but what about customers?
Retailer certificate schemes have been growing in popularity in recent years as a policy mechanism to help deliver the energy transition. The report puts forward some recommendations on how to improve the efficiency of these schemes. It also includes a deeper dive into the Victorian Energy Upgrades program and South Australian Retailer Energy Productivity Scheme.
2025 Election: A tale of two campaigns
The election has been called and the campaigning has started in earnest. With both major parties proposing a markedly different path to deliver the energy transition and to reach net zero, we take a look at what sits beneath the big headlines and analyse how the current Labor Government is tracking towards its targets, and how a potential future Coalition Government might deliver on their commitments.
The return of Trump: What does it mean for Australia’s 2035 target?
Donald Trump’s decisive election win has given him a mandate to enact sweeping policy changes, including in the energy sector, potentially altering the US’s energy landscape. His proposals, which include halting offshore wind projects, withdrawing the US from the Paris Climate Agreement and dismantling the Inflation Reduction Act (IRA), could have a knock-on effect across the globe, as countries try to navigate a path towards net zero. So, what are his policies, and what do they mean for Australia’s own emission reduction targets? We take a look.
Send an email with your question or comment, and include your name and a short message and we'll get back to you shortly.