

by Peter Brook
Dunkelflaute writ large - May 2024?
In the latter half of May 2024 there was an extended wind drought that primarily affected the major wind generating regions of the National Electricity Market (NSW, Victoria and South Australia). What impact did it have on the performance of variable renewable energy (VRE) generators during this period? And does it point to a need for greater geographical dispersion of wind assets? We take a look.
In the following analysis we have used the capacity factors of wind and solar generators during the period to illustrate the impacts. The capacity factor of a generator over a one-hour period is the generation in MWh divided by the registered capacity of the plant.[i] For example, a 100 MW wind farm that generates 20 MW for an hour has a 20 per cent capacity factor for that hour. More information on capacity factors can be found in a 2017 Energy Insider.
Over the eight days from 20-27 May 2024 the capacity factor for the NE MVRE averaged 14 per cent. This is well below the 2023/24 annual capacity factor implicit in the Australian Energy Market Operator’s 2024 Integrated System Plan (ISP) of 25 per cent. VRE capacity factors are seasonal (especially solar) and Figure 1 illustrates this using VRE output (in MWh) over the year.[ii]
Figure 1: NEM VRE production post-coal, based on 80 years of historic weather data
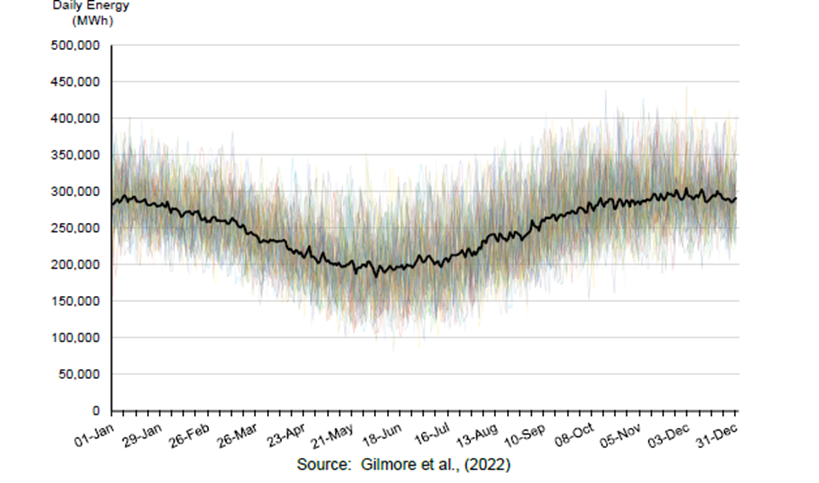
By technology, the average wind capacity factor was 12 per cent and solar was 18 per cent. For 2023/24, the 2024 ISP implied average capacity factor for wind is 28 per cent and 21 per cent for solar.[iii] Hence, wind’s capacity factor was extremely low and it was low to average for solar when considering seasonality.
Wind
Across the regions there were divergent wind capacity factors with Queensland being substantially higher than all the others at 34 per cent. It also had the least variability with a coefficient of variation of 46 per cent. The significance of Queensland’s contribution is clear if its excluded, as it reduces the overall NEM capacity factor to just over nine per cent (see table 1).
Table 1: Average wind capacity factors eight days 20-27 May 2024
|
|
NSW |
QLD |
SA |
TAS |
VIC |
NEM |
NEM ex QLD |
|
Capacity Factor |
7.9% |
34.4% |
10.9% |
20.9% |
8.0% |
11.6% |
9.4% |
|
CV |
112% |
46% |
82% |
74% |
91% |
56% |
69% |
Source: NEOExpress and AEC analysis.
Figure 2 sets out the hourly wind capacity factors which show NSW and Victoria effectively flatlining for extended periods whereas Queensland was below 10 per cent only briefly and peaked at over 70 per cent. To paraphrase a Sesame St song, one of these kids was doing his own thing. Tasmania had some extended high capacity factor periods and also peaked over 70 per cent, but it also had extended low periods.
Figure 2: Hourly wind capacity factors by NEM region eight days 20-27 May 2024

Source: NEOExpress and AEC analysis
The key problem with this drought was that it primarily manifested itself in the three high wind capacity regions such that NSW and Victoria were each eight per cent and SA 11 per cent. As shown in Figure 3, SA, NSW and Victoria account for 86 per cent of wind capacity whereas the regions that did not experience the extreme drought conditions account for nine per cent (Queensland) and five per cent (Tasmania). Hence, their higher capacity factors were unable to effectively counter the reduced output from the other regions. Nevertheless, Queensland was still able to contribute 26 per cent of NEM wind generation output which was the same as Victoria’s contribution.
Figure 3: NEM installed wind and solar capacity (MW) May 2024
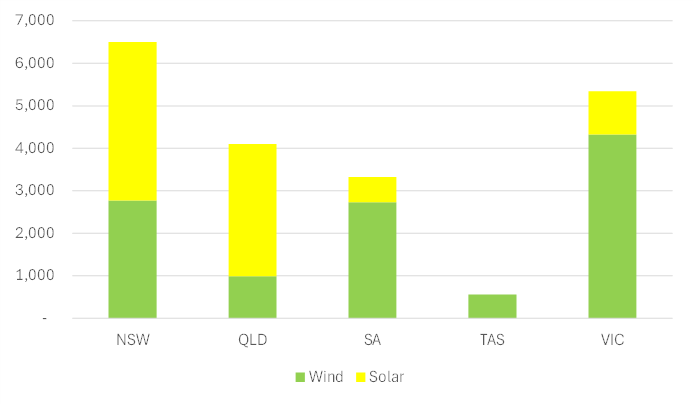
Source: NEOmobile
An eight-day period has been chosen for this analysis because it is the same period that AEMO employs for its VRE drought scenario in the 2024 ISP.[iv] Unlike AEMO’s scenario, this analysis does not exclude Queensland. Nevertheless, it is clear from the data that if the first two days are excluded, thereby creating a six-day period, the intensity of the wind drought increases (see table 2). Both NSW and Victorian capacity factors drop from eight to five per cent and SA drops from 11 to nine per cent. In contrast, both Queensland’s and Tasmania’s capacity factors improve marginally.
If Queensland is excluded, the impact on the NEM’s capacity factor is a fall from nine per cent (see table 1) to seven per cent.
Table 2: Average wind capacity factors six days 22-27 May 2024
|
|
NSW |
QLD |
SA |
TAS |
VIC |
NEM |
NEM ex QLD |
|
Capacity Factor |
5.0% |
35.0% |
8.5% |
23.7% |
4.7% |
9.2% |
6.8% |
Solar
As one would expect, solar capacity factors were not as diverse across NEM regions, with Queensland still the best performer at 19 per cent (see table 3). Queensland also had the second highest share of solar capacity at 27 per cent after NSW at 33 per cent. Accordingly, NSW solar generation accounted for 44 per cent of NEM solar output and Queensland 39 per cent.
Table 3: Average solar capacity factors and total generation eight days 20-27 May 2024
|
|
NSW |
QLD |
SA |
VIC |
NEM |
|
Capacity Factor |
17.6%% |
18.9% |
17.7% |
15.8% |
17.9% |
|
generation GWh |
126.2 |
112.9 |
20.2 |
30.9 |
290.2 |
Wind solar relationship
As illustrated in Figure 5, Queensland’s wind capacity factor exhibited significant negative correlation (minus 0.60) with the NEM’s solar profile. And while wind capacity factors were low for the rest of the NEM, they recorded a correlation of minus 0.46 and minus 0.44, if Tasmania is excluded.
Figure 5: Hourly capacity factors NEM solar, Queensland wind and NEM wind ex Queensland eight days 20-27 May 2024

Source: NEOExpress and AEC analysis
VRE (Wind and Solar combined)
The overall VRE drought for the NEM had an average capacity factor of 14 per cent, and if Queensland is excluded, it drops to 12 per cent. Queensland and Tasmania recorded average capacity factors of 23 and 21 per cent respectively. The worst performing region was Victoria at 10 per cent. The hourly results are presented in Figure 5. The NEM’s VRE capacity factor attains 30-31 per cent for two hours. When Queensland is excluded, the VRE capacity factor attains 25-27 per cent for eight hours.
Figure 6: Hourly VRE capacity factors for eight days 20-27 May 2024

Source: NEOExpress and AEC analysis
Figure 6 displays the contribution of each NEM regions’ VRE in MW on an hourly basis. As can be observed, Queensland and NSW generated the bulk of VRE output over the period. Figure 7 also clearly illustrates how the intensity of the drought will be stronger if the first two days are excluded. For the six-day period 22-27 May 2024 the NEM’s capacity factor is 13 per cent and 11 per cent, excluding Queensland.
Figure 7: Hourly VRE generation (MWh) by NEM region for eight days 20-27 May 2024
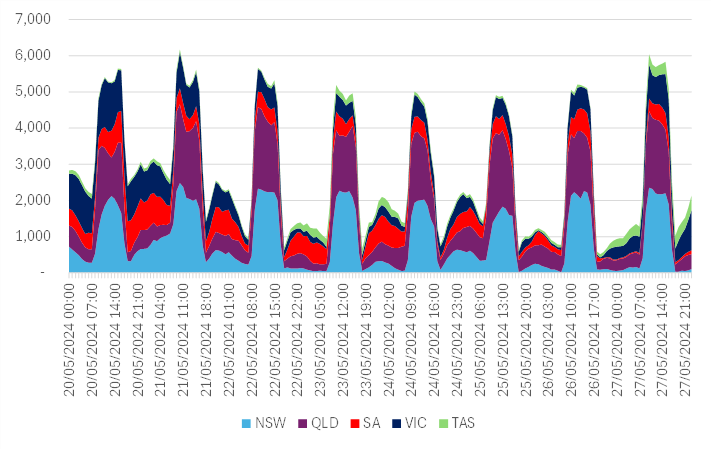
Source: NEOExpress and AEC analysis
Figure 8 shows how NSW’s and Queensland’s contributions were at 64 per cent combined. Whereas the two states with the most wind capacity (SA and Victoria) failed to deliver during this period.
Figure 8: Share of total VRE generation (MWh) by NEM region eight days 20-27 May 2004.

Source: NEOExpress and AEC analysis
Concluding remarks
The analysis presented demonstrates the need for significant geographical dispersion of wind assets to better manage correlation risk, especially as the system increases its dependence on VRE. More wind assets are required primarily in Queensland and also Tasmania. This has been acknowledged with the 2024 ISP setting Queensland wind capacity almost 19 times higher than it currently is, and Tasmania’s almost five times higher by 2040/41.
We are unsure of the probability for this type of drought; however, it is likely to be an uncommon event. When considering wind capacity factor probability, recent observations are likely to be more accurate than historical figures because each year there are more data points in the form of new wind and solar assets. Furthermore, the changing climate and what appears to be increasing volatility may reduce the value of older observations relative to more recent data.
[i] Five-minute averages of as-generated SCADA metering are used to calculate MWh as generated.
[ii] Simshauser. P. and Gilmore. J. “Solving for ‘𝒚𝒚’: demand shocks from Australia’s gas turbine fleet.” March 2024, p.7.
[iii] Chart data for Figures 2 and 9, https://aemo.com.au/-/media/files/major-publications/isp/2024/2024-integrated-system-plan-isp.pdf?la=en. Generation for FY24 is applied the average of installed capacity for FY23 and FY24.
[iv] Figure 24. https://aemo.com.au/-/media/files/major-publications/isp/2024/2024-integrated-system-plan-isp.pdf?la=en
Related Analysis
2025 Election: A tale of two campaigns
The election has been called and the campaigning has started in earnest. With both major parties proposing a markedly different path to deliver the energy transition and to reach net zero, we take a look at what sits beneath the big headlines and analyse how the current Labor Government is tracking towards its targets, and how a potential future Coalition Government might deliver on their commitments.
Navigating Energy Consumer Reforms: What is the impact?
Both the Essential Services Commission (ESC) and Australian Energy Market Commission have recently unveiled consultation papers outlining reforms intended to alleviate the financial burden on energy consumers and further strengthen customer protections. These proposals range from bill crediting mechanisms, additional protections for customers on legacy contracts to the removal of additional fees and charges. We take a closer look at the reforms currently under consultation, examining how they might work in practice and the potential impact on consumers.
Wholesale Market Settings Review – A Shared Vision Is Required
The Federal Government’s review into the National Electricity Market (NEM) wholesale market settings is a crucial step in ensuring reliable energy supply as coal-fired generation phases out and renewables become the dominant energy source. With energy markets worldwide facing the challenge of balancing low-emissions, low-cost generation with the need for firmed energy supply, this review must identify reforms that incentivise investment in flexible, dispatchable generation sources. So, what will be needed in order for this review to succeed? We take a closer look.
Send an email with your question or comment, and include your name and a short message and we'll get back to you shortly.