

by Panos Priftakis
Clean energy investment: How does Australia compare?
In 2015, China topped the rankings for total clean energy investment while Australia ranked 12th according to the Renewable Energy Country Attractiveness Index 2016 report[i]. Although the report refers to Australia as a country that must try hard to compete with the top 10, the Australian Energy Council analysis has shown that on clean energy investment per capita Australia ranks 5th in the world, which is higher than China, India, France and Canada.
Weak economic growth and fragile government finance have made Europe less willing to subsidise renewable-energy investment, which has seen a drop in clean energy investment. Globally the current renewable energy growth trajectory continues to follow the path that coal took when it replaced wood as a fuel source for power generation in the early 1900s. It points to renewable energy’s disruptive potential as its market share grows.
Top 15 Clean Energy Investment Markets
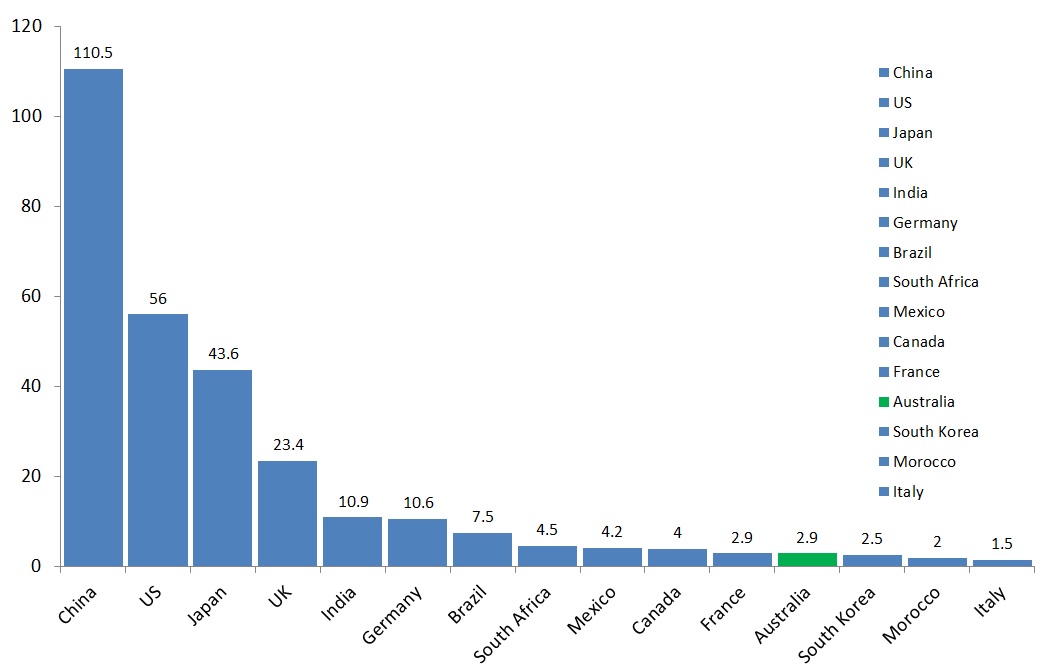
The global energy sector reached a record US$329 billion of new investments in 2015 with the Asia Pacific region at the heart of this boom, according to a new report by EY. The Renewable Energy Country Attractiveness Index 2016 report shows that Asia Pacific secured almost US$180 billion in clean energy investments last year, which was more than half of the global total.
China topped the index with US$110.5 billion in investments, followed by the United States, Japan, the United Kingdom and India. Figure 1 shows the top 15 clean energy markets with Australia ranked 12th at US$2.9 billion.
Figure 1: Top 15 Clean Energy Investment Markets ($b)[ii]
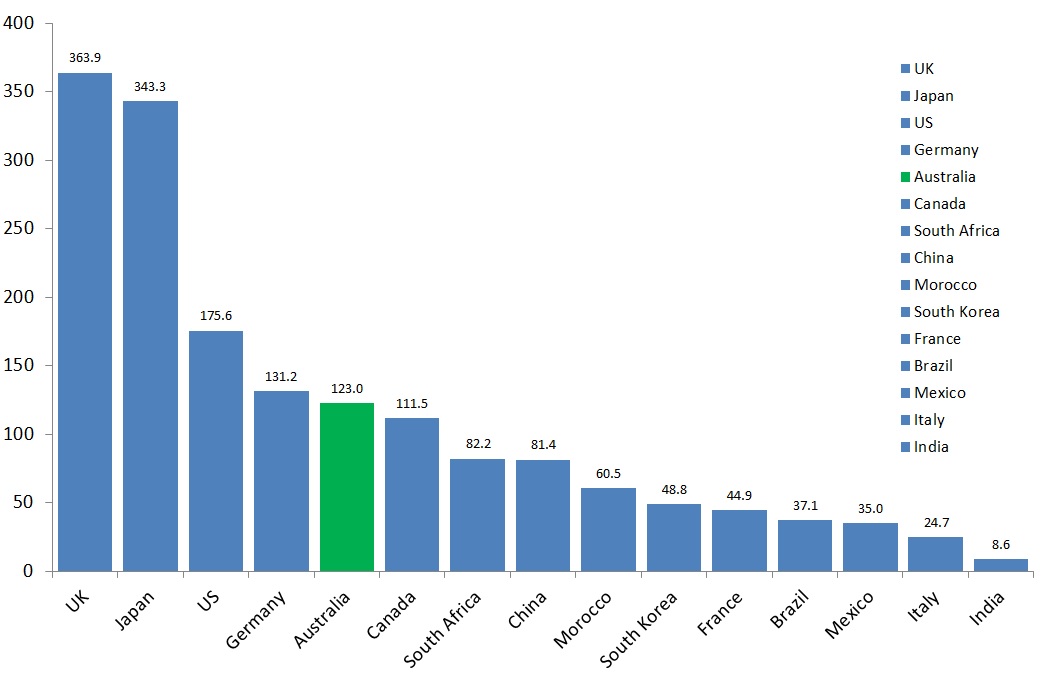
According to the EY report, Australia must try harder to compete with the top 10 countries. The report pointed to the 2015 Abbott Government position on renewables as a reason why Australia needed to improve. Comparing the EY data on a per capita basis though tells a different story. Ranking the top 15 clean energy investment countries on a per capita basis places Australia 5th, which is higher than China, India, France and Canada.
The rankings also highlight the performance of the UK, which topped the per capita rankings. In the UK, wind and solar generation increased by 33 per cent (+11.9 TWh) in 2015 on the previous year[iii].
Figure 2: Top 15 Clean Energy Investment - $ per capita[iv]
Wind and solar the main contributors
Wind and solar continue to be the key energy sources driving the spike in global renewable energy investment according to the EY report. Together wind and solar accounted for over 80 per cent of clean energy investments in 2015, costing US$270 billion. The remaining funds have been spent on smart, digital and storage technologies.
It is unclear why the EY report lumps “smart, digital and storage technologies” in with renewable generation in their “clean energy investment”. These are not generation technologies and are neither “clean” nor “dirty”, but are enabling technologies. As enabling technologies they are likely to rise in importance as more intermittent renewables are put into energy systems.
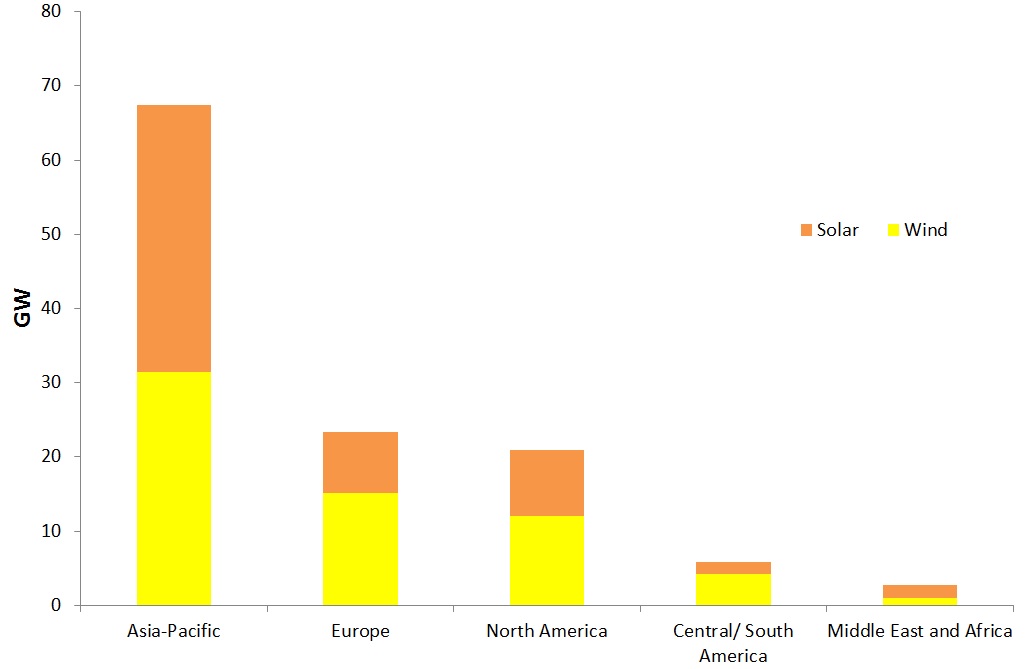
In 2015, the Asia-Pacific region installed the highest level of wind and solar capacity, which was predominantly driven by China.
Figure 3: New wind and solar capacity installed in 2015 by region[v]
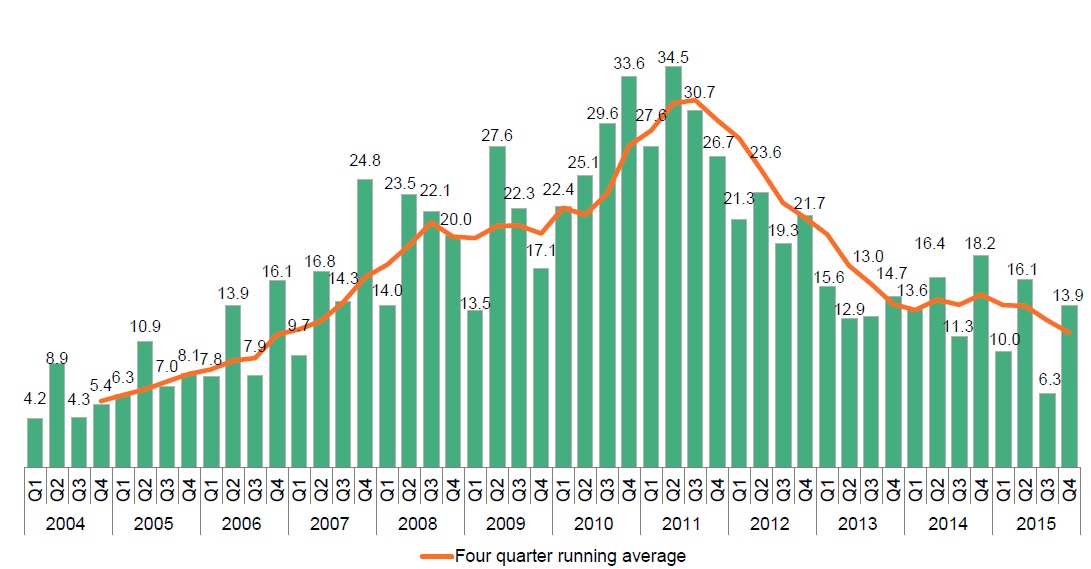
While the Asia Pacific region leads the world in clean energy investment, Europe has seen a drop in investment in recent times. Weak economic growth and fragile government finance have made Europe less willing to subsidise renewable-energy investment, and the impact can be seen in Figure 4. China’s investment in clean energy, particularly solar, relies heavily on Beijing’s continued subsidies, which have resulted in plummeting equipment costs. Lower growth in China’s economy could impact the growth in the renewable market.
Figure 4: New Investment in Clean Energy in Europe – Q1 2004-Q4 2015 ($BN)[vi]
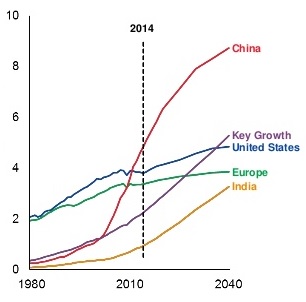
What is missing from the EY report is any analysis on the role of demand trends on the current results. With continuing demand growth in China there is a clear reason why they have been building more renewables, unlike Europe and Australia who have had relatively stable investment. Figure 5 shows the difference in growth between China and Europe, as well as projected growth.
Figure 5: Electricity Demand by region[vii]
Energy Evolution Has Happened Before
If renewable energy replaces fossil fuels as the main source of energy worldwide it won't be the first time a fuel source was rapidly replaced. Looking at the US and Australia, natural gas and coal have been the leading sources of energy generation, although the energy mix has changed significantly in the two countries over the past two centuries. Australia and the US obtained nearly all of their energy from burning wood prior to the 1900s. Wood as an energy source was plentiful and relatively cheap. Since the 1900s wood has almost entirely been replaced by coal and natural gas in Australia and the US. The timescale for a shift in the US energy mix is shown below.
Figure 6: History of the relative mix of the main source of energy used in the United States – 1850-2000[viii]
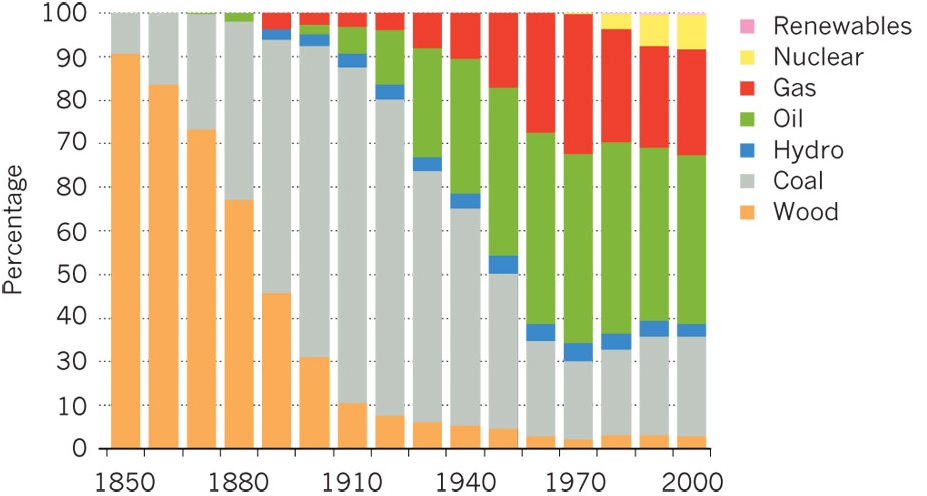
As seen in Figure 6, coal largely replaced wood due to the environmental impact, including the destruction of forests. The current renewable energy trend for wind and solar is following a trajectory that looks like coal’s emergence in the 1900s. It points to renewable energy’s disruptive potential as its market share grows.
[i] EY, 2016, “Renewable Energy Country attractiveness Index – Issue 46, February 2016”
[ii] Source: EY, 2016, “Renewable Energy Country attractiveness Index – Issue 46, February 2016”
[iv] Source: EY and Australian Energy Council Analysis
[v] Source: EY, 2016, “Renewable Energy Country attractiveness Index – Issue 46, February 2016”
[vi] Mills, L, and Bryne, J, 2016, “Clean Energy Investment: Q4 2015 Factpack, Bloomberg New Energy Finance,
Related Analysis
The ‘f’ word that’s critical to ensuring a successful global energy transition
You might not be aware but there’s a new ‘f’ word being floated in the energy industry. Ok, maybe it’s not that new, but it is becoming increasingly important as the world transitions to a low emissions energy system. That word is flexibility. The concept of flexibility came up time and time again at the recent International Electricity Summit held in in Sendai, Japan, which considered how the energy transition is being navigated globally. Read more
Nuclear Fusion Deals – Based on reality or a dream?
Last week, Italian energy company ENI announced a $1 billion (USD) purchase of electricity from U.S.-based Commonwealth Fusion Systems (CFS), described as the world’s leading commercial fusion energy company and backed by Bill Gates’ Breakthrough Energy Ventures. CFS plans to start building its Arc facility in 2027–28, targeting electricity supply to the grid in the early 2030s. Earlier this year, Google also signed a commercial agreement with CFS. These are considered the world’s first commercial fusion-power deals. While they offer optimism for fusion as a clean, abundant energy source, they also recall decades of “breakthrough” announcements that have yet to deliver practical, grid-ready power. The key question remains: how close is fusion to being not only proven, but scalable and commercially viable, and which projects worldwide are shaping its future?
Community Power Network Trial: Potential risks and market impact
Australia leads the world in rooftop solar, yet renters, apartment dwellers and low-income households remain excluded from many of the benefits. Ausgrid’s proposed Community Power Network trial seeks to address this gap by installing and operating shared solar and batteries, with returns redistributed to local customers. While the model could broaden access, it also challenges the long-standing separation between monopoly networks and contestable markets, raising questions about precedent, competitive neutrality, cross-subsidies, and the potential for market distortion. We take a look at the trial’s design, its domestic and international precedents, associated risks and considerations, and the broader implications for the energy market.
Send an email with your question or comment, and include your name and a short message and we'll get back to you shortly.