

by Carol Tran
Capacity factors: Understanding the misunderstood
With the current debate about the future of the Liddell Power Station in New South Wales, some media have focused on the plant’s capacity factor[i].
While the total megawatt (MW) capacity of generation is often quoted to assess a plant’s capabilities, it can be misleading given power plants do not run 100 per cent of the time. Two plants with the same capacity may produce quite different levels of energy across the year. Capacity factor gives the share of the actual electricity generated by a plant.
The analysis of plant capacity factors in Australia is outlined in Table 1.
Table 1: The capacity load factor of principal generation plants throughout Australia in the last two financial years.

Source: Australian Energy Council Analysis, 2017 Note: Western Australia data includes all energy entering into the system from market generators in the South West Interconnected System with a capacity equal or greater than 10 MW.
As an example, in 2015-16, in Western Australia, the average available output of the combined principal power plants portfolio is about 33 per cent of the installed capacity. This means that the output of the installed 6,208 MW is only 2,048 MW averaged over a year.
Coal-fired generators have had the highest capacity factor in all states, except for Tasmania and Northern Territory as shown in Figure 1, where the primary generation is from hydro and gas-fired plants respectively. Coal power plants have typically operated throughout the year as baseload generation sources. Due to the prevalence of hydro plants in Tasmania, the capacity factor of hydropower for the state is the highest, reaching 41 per cent in 2015-16. The highest gas capacity factor was recorded in the Northern Territory and Queensland.
The capacity factors in Figure 1 are over the year and average out any temporary fluctuations in generation.
Figure 1: Principal plants’ capacity factor (%) in 2015-16

Source: Electricity Gas Australia 2017, Australian Energy Council. Note: The figures exclude solar and FY 2015-16 is a leap year, 8,784-hour was used in calculation a) In South Australia, Northern Power Station was the only operating coal power station, which operated for 314 days during FY 2015-16 before its final closure on 10th of May 2016. Capacity load factor is calculated based on the 314 day period. b) Including coal seam methane and coal waste methane c) Excluding pump storage plants d) Including both principal and embedded wind generators
The change in coal usage
Figure 2 shows the yearly capacity factor of coal power plants over a 10-year period. Brown coal power plants in Victoria continued to have the highest capacity factors. In 2015-16, coal capacity factors across Australia showed little decline compared to financial year 2014-15, except in Victoria. Drilling further into the data, beside the exit of Anglesea power station, other brown coal power plants in Victoria produced less generation that year in comparison to the previous corresponding period, leading to a lower capacity factor for the state, as seen in Figure 2. A continuing fall in electricity demand in Victoria appeared to be the key reason even though the state has the highest population growth in the nation[ii]. The state’s residential and commercial demand was offset by reductions in industrial electricity demand[iii].
Upon the closure of Hazelwood coal-fired plant in 2016-17 and the complete exit of coal plants in South Australia, the remaining plants increased power generation across the NEM region, which in turn resulted in a higher level of capacity factor due to a reduction in available generation.
Figure 2: Coal-fired generator capacity factors across Australia
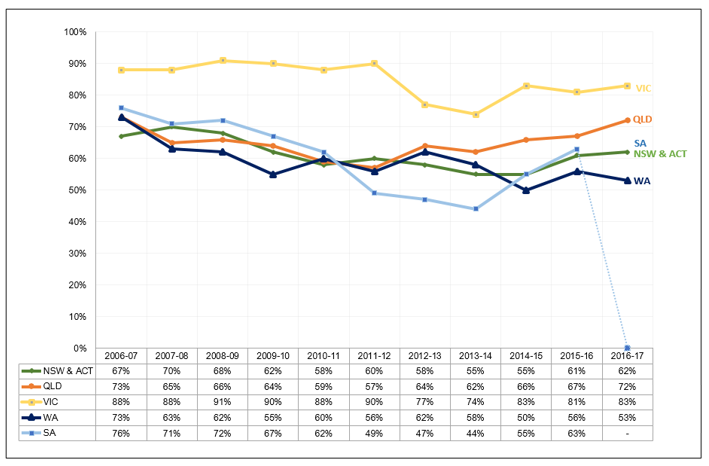
Source: Electricity Gas Australia 2008 – 2015, Electricity Supply Association, Electricity Gas Australia 2016 – 2017, Australian Energy Council
Note: In South Australia, Playford operated for 244 days during FY 2011-12 before being mothballed. From that time only Northern Power Station was used in capacity factor calculation until it was completely closed in May 2016. In Western Australia, only the SWIS region is included.
A carbon price was in place in Australia during 2012-14, which led to lower capacity factor in many states.
During 2012-13, Queensland’s Tarong power station closed half of its capacity (two 350MW units in October and December 2012 respectively) with oversupply cited as a key factor and subsequently announced they would be brought back into service[iv]. Meanwhile the Swanbank E gas-fired power station was removed from service[v]. This year the State Government announced it would return to service in 2018[vi] as a result of tightening supply and higher wholesale prices.
South Australia showed a big shift in the capacity factor of its coal-fired plants prior to their closure. For example, in May 2016 the Northern Power station had a capacity factor of 63 per cent (compared to 76 per cent in 2006-07). South Australian coal plant capacity factors fell in 2011-12 when the Playford power station operated for just 244 days prior to its mothballing.
The financial year 2015-16 marked the end of coal-fired generation in South Australia. The closure of Northern Power Station (and Playford B, which had been mothballed since 2012), means that South Australia will expect to see higher capacity factors for its remaining dispatchable, gas-fired power stations in future years. Capacity factors for wind and solar plant however, is unlikely to be affected given it is still determined by the availability of wind and sun.
Wind and Solar
Wind turbines or solar farms generally have low capacity factors given the intermittency of the electricity they produce. With South Australia’s superior wind resource, the state has received the most investment in wind generation over the past decade[vii], so it is worth taking a closer look at the performance of South Australian wind generation.
Figure 3 shows the number of days below a certain output level for South Australian wind farms. For a total of 206 days (56.4 per cent of the total number of days throughout the 2016-17 financial year) wind output was below 30 per cent capacity, while for 297 days (81.4 per cent) wind output for the state was below 50 per cent of total capacity. Actual output from wind farms in South Australia during 2015-16 and 2016-17 on average are 33.4 and 30.9 per cent respectively.
Figure 3: Histograms of capacity factor of wind in South Australia in the last two financial years

Source: Electricity Gas Australia 2017, Australian Energy Council
Tasmania has significantly high capacity factor wind resource sites (reaching 37 per cent). AEMO expected Tasmania’s wind resources could contribute a minimum of 8.5 per cent during peak demand, compared to a minimum of 9.4 per cent in South Australia[viii].
Conclusion
As more and more dispatchable electricity generators exit the market (such as Northern, Playford and Yallourn) there will be a requirement to source dispatchable generation from elsewhere in the market. This has been reinforced recently by the Australian Energy Market Operator’s report to the Federal Government, which prompted the current discussions over the future of the Liddell Power Station and coal-fired generation.
[i] https://www.brisbanetimes.com.au/politics/nsw/liddell-power-plant-operating-below-40-per-cent-capacity-faces-mammoth-woes-20170907-gycij7.html
[ii] ABS, 2016, cat no. 3101.0, Australian Demographic Statistics.
[iii] Lower Lows for Electricity Demand in Victoria, Australian Energy Council, 09-02-2017, https://www.energycouncil.com.au/analysis/lower-lows-for-electricity-demand-in-victoria/
[iv] http://www.stanwell.com/news/tarong-power-station-return-generating-units-service/
[v] http://www.stanwell.com/news/tarong-power-station-return-generating-units-service/
[vi] http://www.stanwell.com/news/press-releases/swanbank-e-power-station-return-service/
[vii] “What’s the market for wind in 2017?”, Australian Energy Council, 23-02-2017, https://www.energycouncil.com.au/analysis/whats-the-market-for-wind-look-like-in-2017/
[viii] Table 7 Expected wind contribution during peak demand (% of registered wind capacity), South Australian Renewable Energy Report, AEMO, December 2016.
Related Analysis
Integrated System Plan – What Should We Expect?
The release of an expert study of last year’s autumn wind drought in Australia by consultancy Global Power Energy[i] this week raised some questions about the approach used by the Australian Energy Market Operator’s in its 2024 Integrated System Plan (ISP). The ISP has been subject to debate before. For example, there has previously been criticism that some of the ISP’s modelling assumes what amounts to “perfect foresight” of wind and solar output and demand[ii], rather than a series of inputs and assumptions. The ISP is produced every two years and with the draft of the next ISP (2026) due for release soon, it is useful to consider what it is and what it is not, along with what the ISP seeks to do.
The energy transition and power bills: Why aren’t they cheaper?
With energy prices increasing for households and businesses there is the question: why aren’t we seeing lower bills given the promise of cheaper energy with increasing amounts of renewables in the grid. A recent working paper published by Griffith University’s Centre for Applied Energy Economics & Policy Research has tested the proposition of whether a renewables grid is cheaper than a counterfactual grid that has only coal and gas as new entrants. It provides good insights into the dynamics that have been at play.
2025 Election: A tale of two campaigns
The election has been called and the campaigning has started in earnest. With both major parties proposing a markedly different path to deliver the energy transition and to reach net zero, we take a look at what sits beneath the big headlines and analyse how the current Labor Government is tracking towards its targets, and how a potential future Coalition Government might deliver on their commitments.
Send an email with your question or comment, and include your name and a short message and we'll get back to you shortly.