

by Justine Lovell
Australian Energy Update: What's changed in energy supply and use?
Total electricity generation reached 258 terawatt hours (equivalent to 929 petajoules) in 2016-17, the highest total generation recorded to date, although only an increase of 0.2 per cent, according to the 2018 Australian Energy Update.
The total includes electricity generated from rooftop solar PV, generation by industrial facilities (mining, manufacturing) and off-grid generation. Industry and households attributed around 12 per cent of the nation’s electricity generation (Figure 1).
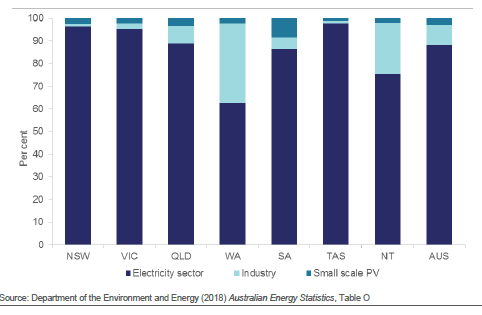
Figure 1: Australian electricity generation, by industry, 2016–17
The Update is an annual report designed to increase the understanding of energy supply and use in Australia. It highlights recent trends in energy consumption, production, generation and trade during the 2016-17 period.
It shows that coal continued to provide the majority of Australia’s electricity generation at 63 per cent of total generation in 2016-17, although the nation is now less reliant on coal compared to a decade ago when it held an 80 per cent share. While black coal increased by 4 per cent due to increases in generation in New South Wales, Western Australia and Queensland, it was offset by brown coal’s decline of 11 per cent, reflecting the closure of Hazelwood and Northern power stations during the period.
Natural gas-fired generation was up in Victoria, Western Australia and South Australia, but overall it fell by 0.2 per cent, to account for 20 per cent of the nation’s overall generation in 2016-17.
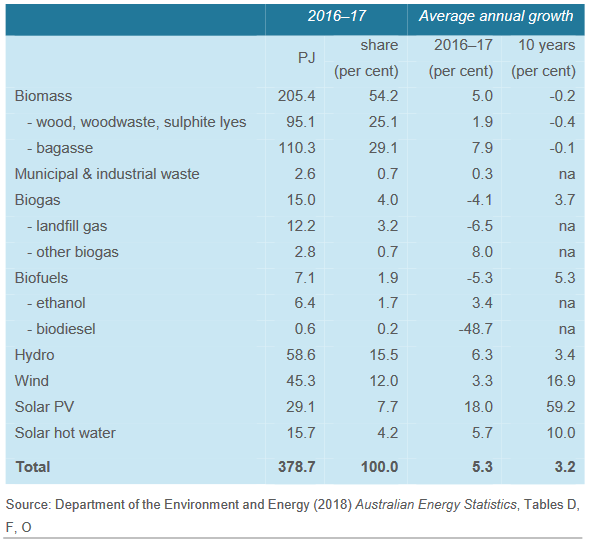
Renewable generation accounted for 16 per cent of total generation in 2016-17, rising by 6 per cent due to increases in solar, hydro and wind. Generation from renewables has more than doubled over the past decade.
Hydro remains the largest source of renewable electricity generation contributing 40 per cent in 2016-17, however it remains well below its 95 per cent share of renewable generation in 2000-01, largely due to increased diversification in renewable sources. Wind contributed 31 per cent and solar also grew strongly to 18 per cent of renewable electricity generation.
However, when looking at the 2017 calendar year, renewable generation declined slightly to 15 per cent of total generation, due to a fall in hydro output later in the year.
Overall energy consumption
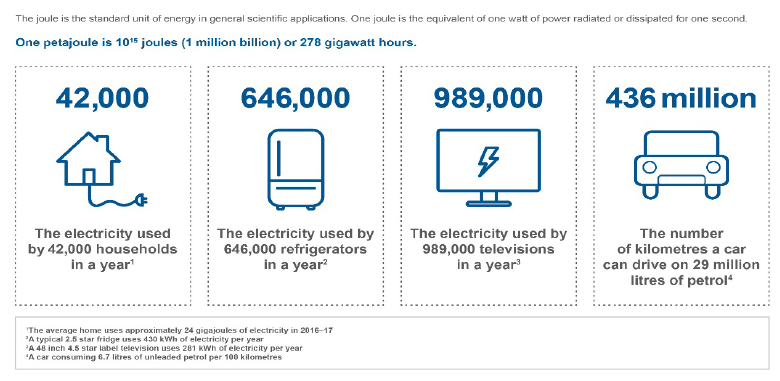
Overall, Australia’s energy consumption increased by 1 per cent in 2016-17 – or 65 petajoules - the equivalent amount of energy from filling a 55-litre tank of petrol 34 million times, according to the report.
It found that while overall energy consumption increased to 6146 petajoules in 2016-17, Australia is now using around 20 per cent less energy per person than at the start of the century.
The nation is also creating more value from the energy we consume. Energy productivity has increased by 17 per cent over the past decade. For every petajoule of energy consumed in 2016-17, gross domestic product increased by $275 million, nearly $50 million more per petajoule than a decade ago.
Figure 2: One petajoule explained
Consumption and fuel mix
The Update found that electricity generation and transport remained the largest energy-consuming activities in 2016-17, both with a 27.5 per cent share. Commercial energy consumption grew by 1.7 per cent (to 344.6 PJ), while residential use declined slightly by 0.5 per cent in 2016-17 (to 458.4 PJ).
Most of the electricity supply sector’s consumption was in plants producing liquefied natural gas (LNG), supporting growth in gas export volumes of 41 per cent. However despite slightly higher output, energy use for the electricity generation sector fell by 2 per cent in 2016-17, due to reduced brown coal consumption (with the closure of the Hazelwood power station) and increased renewable generation.
Across the nation, oil remained the largest energy source of the nation’s primary energy mix at 37.7 per cent of total energy consumption in 2016-17. Coal was second, providing a further 31.5 per cent - well below its 2008-09 peak of 40 per cent.
Coal consumption fell by 1 per cent (reversing growth in the previous two years) during 2016-17. The Update notes that this decline was due to a drop in brown coal consumption after the closure of Hazelwood and Northern power stations, which offset an increase in black coal use (as black coal-fired plants increased output).
Figure 3: Australian energy consumption, by fuel type
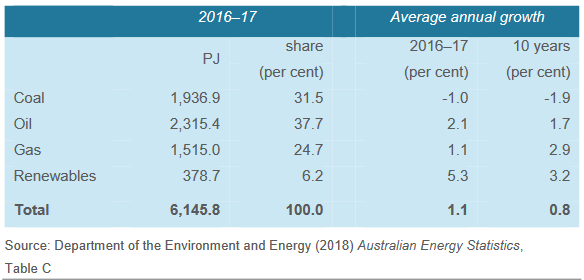
Natural gas made-up 24.7 per cent of the nation’s fuel mix, rising by 1 per cent in 2016-17. Around 37 per cent of Australia’s gas consumption was for electricity generation, with around another third used by industry, including smelters, refineries and mine sites.
Renewables rose in 2016-17 to make up 6.2 per cent of the fuel mix, driven largely by biomass (which includes bagasse used in manufacturing), hydro and wind energy. Consumption of renewables also increased by 5 per cent, led by biomass, solar PV and hydro (Figure 4).
Figure 4: Australian renewable energy consumption, by fuel type
Energy use by state
Across the country, Western Australia saw the strongest growth in energy use during 2016-17. Energy consumption in the state rose by 5 per cent, with almost all of the growth coming from the mining sector.
Queensland’s energy consumption also grew by 4 per cent, with the largest increase coming from mining, manufacturing, electricity generation and transport.
Figure 5: Australian energy mix, by state and territory, 2016–17
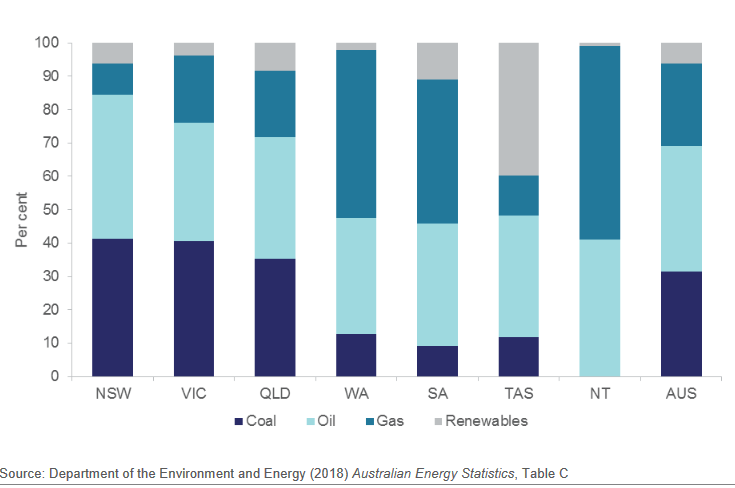
Energy consumption dropped in Victoria by 2 per cent during 2016-17, which again, reflects the drop in brown coal consumption after the closure of Hazelwood power station. South Australia also experienced a decline which is also explained by the closure of coal-fired generation capacity.
New South Wales experienced growth of 1 per cent, attributable to the transport sector. While energy consumption in Tasmania and the Northern Territory rose slightly over the 12 months to 1.8 per cent and 1.4 per cent, respectively.
Trade
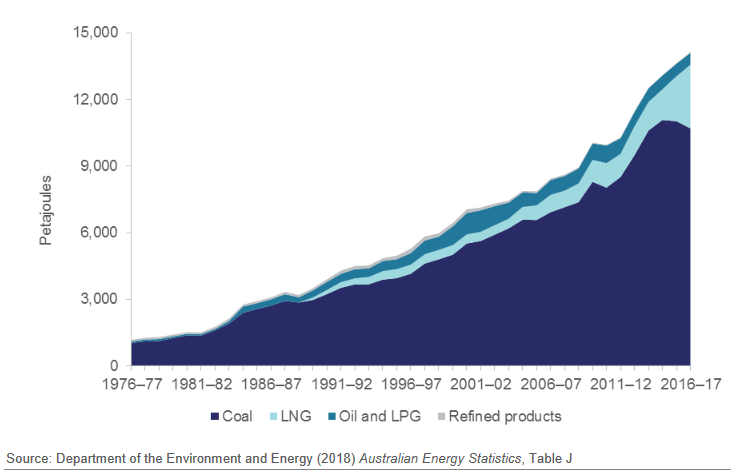
Australia continued to be a significant exporter of energy during 2016-17, with net exports equal to two-thirds of production in 2016-17. The nation’s exports grew by 4 per cent (to reach 14,140 petajoules), which was largely supported by a 41.4 per cent annual growth of LNG exports (Figure 6).
LNG exports increased by 41 per cent, to 2,865 petajoules as new capacity came online in Queensland and Western Australia. Due to several new facilities coming online, on average, LNG exports have increased by 16 per cent a year over the past decade.
However, while black coal exports fell by 3 per cent (to 10,686 petajoules), it still remains the nation’s biggest export. On average, coal exports have grown 5 per cent year on year. Around 88 per cent of black coal production was exported in 2016-17, compared to 69 per cent of natural gas.
Figure 6: Australian energy exports by fuel type
Australia also accounted for around 11 per cent of global uranium production in 2016-17, which is enriched overseas for use in nuclear power plants. Urianium exports declined by 5 per cent over the 12-months, due to the closure of Olympic Dam for upgrades.
Related Analysis
2025 Election: A tale of two campaigns
The election has been called and the campaigning has started in earnest. With both major parties proposing a markedly different path to deliver the energy transition and to reach net zero, we take a look at what sits beneath the big headlines and analyse how the current Labor Government is tracking towards its targets, and how a potential future Coalition Government might deliver on their commitments.
Transmission Access Reform: Has the time passed?
Last week submissions to the AEMC’s Transmission Access Reform consultation paper closed. It is the latest in a long running consideration of how best to ensure both efficient dispatch and investment in new generation to ensure new kit is sited in the best locations. But this continued pursuit of reform brings to the fore the question of whether other policy initiatives have already superseded the need for the proposed changes. We take a look at where the reform proposals have come from, as well as concerns about the suggested approach that have emerged.
EPBC Act: Does the Government have its finger on a climate trigger?
The Government’s Nature Positive Plan Reform has reignited the debate on whether Australia should add a climate trigger into our environmental protection laws. This was sparked after the Government announced stage three of the Nature Positive Plan would be focusing on “climate-related reforms, including the interaction between environment and climate laws.” So, what is a climate trigger and why is it such a contentious issue? We take a closer look.
Send an email with your question or comment, and include your name and a short message and we'll get back to you shortly.