

by Emma Richardson
What's the market for wind in 2017?
Wind generation technology is well-established in Australia, supplying over 4 per cent, or almost 8 TWh, of power to the National Electricity Market (NEM) in 2016[i]. Large-scale deployment of wind, knowledge sharing and economies of scale were supposed to deliver low cost projects and accelerate deployment, yet as we approach the 2020 deadline for the Renewable Energy Target (to achieve 23.5 per cent renewable energy[ii]) it appears unlikely that enough projects will make it over the commercial hurdles to demonstrate a return and commence construction. One consequence is that state governments are proposing their own renewable energy incentives to encourage renewable projects, which will help meet the national target. Despite Australia’s strong wind resources, analysis from Germany’s Agora Energiewende put Australia’s onshore wind projects as the most expensive on their list- at 62 euros per megawatt hour[iii]. While this is based on International Energy Agency (IEA) data from 2015 and reflects the Australian dollar to Euros exchange rate at the time, it provides some indication of where we sit against other nations.
Figure 1: Australia’s onshore wind projects compared to other nations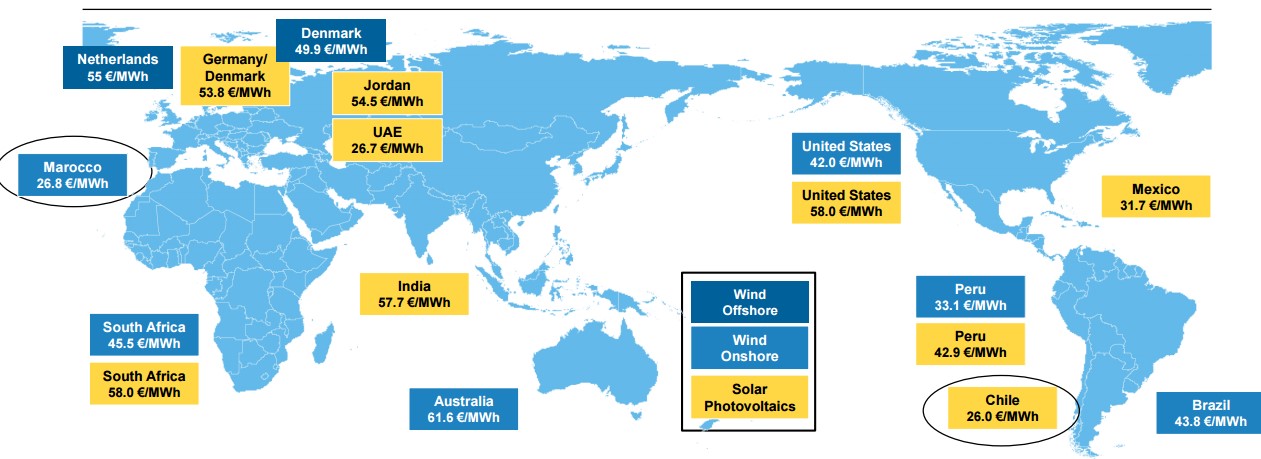
Source: Agora Energiewende, 2016
So what happened? Where are all the counterparties to sign contracts with renewable generators coming down the cost curve? The answer lies in the design of renewables policy, policy risk and declining marginal benefits.
In 2016, the average price wind generators received in the South Australian region was 27 per cent lower than the regional average price, $57/MWh for wind compared to $79/MWh for all generation (Table 1). Policy design to increase the deployment of renewable generation needs to incorporate these signals from the wholesale market about where and when generation is most valuable.
Table 1: Volume weighted price wind generators received in South Australia - 2016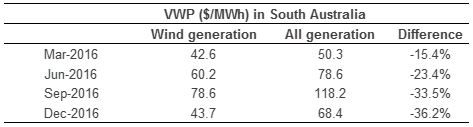
Source: NEM Review and AEC calculations, 2017
Wholesale electricity prices are a key element in determining whether potential renewable projects will create a return, and assisting developers to reach a final investment decision. So wholesale market prices are a key determinant of whether renewable generators enter the market and whether the Renewable Energy Target (RET) can be met. The decision to enter the market is based on an estimate of positive returns over the life of the generating asset. Revenue is determined by production, the volume weighted price (VWP) from the wholesale market and the large-scale generation certificate (LGC) price[iv]. These need to add up to at least the long run costs of the generator (approximated to the levelised cost of energy, or LCOE).
With its superior wind resources, South Australia has received the most investment in wind generation over the last decade. The recent AEMO 2015 South Australian fuel and technology report estimated the LCOE for onshore wind to be $99/MWh[v]. The estimate is based on outdated data now and falling technology costs for wind means that the LCOE could be lower. One approximation for a more up-to-date estimate is the latest winner of the ACT Government’s second wind farm auction. Hornsdale Wind Farm contracted with the ACT Government to supply generation at $77/MWh. While this is a reflection of the costs of one specific project, it indicates that the LCOE has fallen since AEMO’s 2015 estimate and the cost of wind generation is lower. In 2015, the Clean Energy Regulator estimated the volume weighted average LCG price was $29[vi], but by January 2017 Green Energy Markets reported that LGC prices were around $87 (almost as much as the LCOE estimate).
‘The LGC spot price started January [2017] at $86.90 and finishing the month at $88.00’[vii].
New projects will not receive revenue from LGCs for the life of the project, which could be more than 20 years. LGCs expire in 2030 with the expiry of the Renewable Energy Target Scheme, so even if there was more revenue certainty from LGCs it would not continue for the life of an asset. In the long run, all projects will still need to run profitably based on expectations of wholesale price revenue.
Table 2 presents a scenario in South Australia which assumes that a wind farm requires a minimum $99 MWh in total to be viable (AEMO's LCOE estimate). Based on the VWA price for wind the table shows what would be needed to invest in new wind generation in South Australia. In 2016, the VWA price for all generation in South Australia was around $79 MWh. But the VWA price for wind generation in South Australia was $57 MWh, substantially less than the price needed by a new wind developer to invest.
Table 2: Requirement for minimum $99/MWh wind project in South Australia, 2016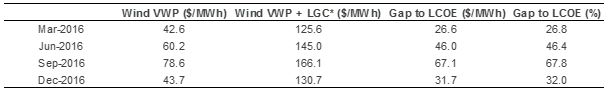 Source: NEM Review, Green Energy Markets and AEC calculations.
* The LGC price is the average spot price through the quarter sourced from Green Energy Markets reports.
But despite lower wholesale prices, the data shows that the gap between expected revenues and the LCOE for wind closed in 2016. The high price of LGCs is offsetting lower revenue from the wholesale market for wind generation. For the quarter ending December 2016, the VWP + LGC price adds up to over $130 MWh, meaning the revenue for wind energy is substantially higher than the LCOE of $99 MWh for wind. This demonstrates to the market the attractiveness of investment, and despite the suppression of wholesale prices in South Australia, the higher LGC price is offsetting the loss. But policy uncertainty is inhibiting commercial investment.
New wind generators in a region with identical wind resources face lower and lower wholesale prices as more enter the market. Counterparties are reluctant to sign long-term supply agreements because of the uncertainty about the LGC price and lower wholesale prices. As a result of the uncertainty driven by policy change at the state and national level, investment in new renewable projects is largely underpinned by additional government support. Until the post‑2020 LGC price can be estimated with confidence and investors have some confidence in the wholesale price outlook, investment will continue to need additional government support
Prevailing winds along the southern states of Australia mean that the wind farms in South Australia tend to generate at the same time of day, at a similar level of production. The wind is not always correlated with the demand for electricity in the region. Figure 2 below shows that over 2016, wind generation was consistently generating throughout the day and night, but was most productive in the early morning before 8am. As a result, wind generation tends to produce during times of abundant supply, and Figure 3 shows most wind generation occurred in settlement intervals with a spot price of $1-50/MWh. In order for new renewable projects to provide the greatest value to consumers, there should be diversity in supply and an ability to meet demand when it is required.
Figure 2: 2016 wind production by time of day and peak demand times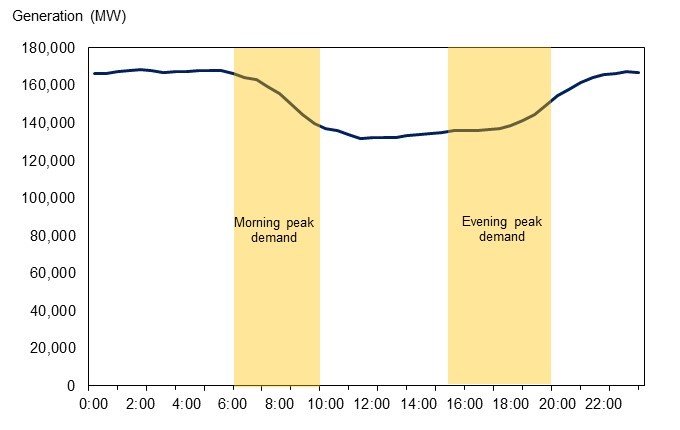
Source: NEM Review, 2017
Figure 3: Frequency of wind generation by wholesale spot price - 2016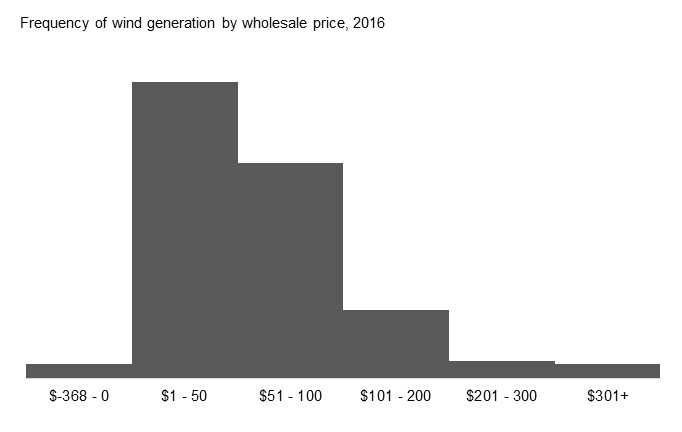
Source: NEM Review, 2017
The lower average wholesale price for wind generation and investment uncertainty reveal important lessons for policy makers:
- As more wind generators are added to a region of the same wind resource, the need for government intervention to cover the gap between revenue and cost rises.
- Setting incentives based on the volume of production, rather than responsiveness to demand results in producers being insensitive to changes in demand and price.
- Prevailing wind resources in a given region can result in wind farms generating on average at the same time and with the same intensity. This results in low wholesale prices at times of high wind generation and high wholesale prices at times of low wind generation.
- As more generators enter the market with similar production profiles to existing generators, the value of one additional megawatt of production falls. The wholesale revenue to new entrants is lower and signals to developers to locate elsewhere.
- The flip side of this is higher marginal value for production that offers something different. In the case of generation in South Australia, firm generation that fills the gaps when wind is not generating is relatively high value.
South Australia provides valuable insights into the operation of a competitive wholesale market for electricity. It is an important test case to learn to operate an electricity grid with a high share of intermittent generation. At a point, the market supresses the price that like-generators receive and rewards generation that can meet demand when it is needed. Policy should reflect this strong signal from the market, and find ways to reward projects that can provide energy consumers with firm supply, when consumers need it. This might include a project developer:
- Using hydro or battery storage options, to store surplus energy when renewable resources are strong, then discharge energy into the market when demand is high.
- Aggregated supply of energy from projects across regions with complementary renewable resources.
- Supplying firm generation using a combination of intermittent renewables and firm generation on site.
- Designing renewable plants to maximise generation at times of peak demand in a region, such as aligning solar panels west to maximise summer evening production which coincides with summer peak demand.
Australia’s large-scale RET requires around 6,000 megawatts (MW) of new renewables to be built by 2020, which is likely to consist of approximately 75 per cent wind and 25 per cent solar[viii]. If we want to transition to a lower carbon energy supply we cannot risk undermining investment in the technologies that bring about this change. The market provides important information to investors about when and where generation is most valuable and South Australia is showing signs that the region is saturated for wind generation. Figure 4 below shows that when wind generation is high, wholesale prices tend to be low in the region. It is essential to preserve this feedback between consumers and generators to ensure investment in the sector is not undermined in the long term.
Figure 4: South Australia’s wind generation by trading interval and price - 2016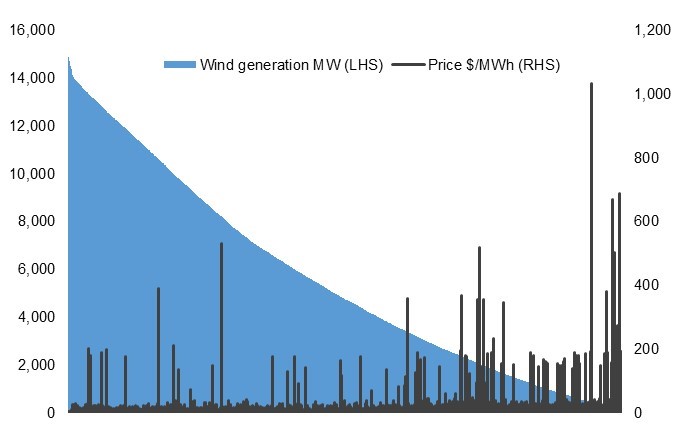
Source: NEM Review, 2017
[i] NEM Review, 2017, market data.
[ii] Department of Environment and Energy, 2017, Renewable Energy Target Scheme, http://www.environment.gov.au/climate-change/renewable-energy-target-scheme
[iii] Agora Energiewende, 2016, https://www.agora-energiewende.de/fileadmin/Projekte/2017/Jahresauswertung_2016/Die_Energiewende_im_Stromsektor_2016_EN.pdf
[iv] Wind generation revenue: f(wholesale price, LCG price).
[v] AEMO, 2015, South Australian Fuel and Technology Report, https://www.aemo.com.au/Datasource/Archives/Archive1434
[vi] Clean Energy Regulator, 2016, Volume weighted average market price for large-scale generation certificates, http://www.cleanenergyregulator.gov.au/RET/Scheme-participants-and-industry/Industry-assistance/Industry-assistance-published-information/Volume-weighted-average-market-price-for-large-scale-generation-certificates
[vii] Green Energy Markets, 2017, LGC Monthly Snapshot: January 2017.
[viii] Clean Energy Regulator, 2015, Renewable Energy Target Administrative Report and Annual Statement, p.68, http://www.cleanenergyregulator.gov.au/About/Accountability-and-reporting/administrative-reports/the-renewable-energy-target-2015-administrative-report
Related Analysis
Nuclear Fusion Deals – Based on reality or a dream?
Last week, Italian energy company ENI announced a $1 billion (USD) purchase of electricity from U.S.-based Commonwealth Fusion Systems (CFS), described as the world’s leading commercial fusion energy company and backed by Bill Gates’ Breakthrough Energy Ventures. CFS plans to start building its Arc facility in 2027–28, targeting electricity supply to the grid in the early 2030s. Earlier this year, Google also signed a commercial agreement with CFS. These are considered the world’s first commercial fusion-power deals. While they offer optimism for fusion as a clean, abundant energy source, they also recall decades of “breakthrough” announcements that have yet to deliver practical, grid-ready power. The key question remains: how close is fusion to being not only proven, but scalable and commercially viable, and which projects worldwide are shaping its future?
Community Power Network Trial: Potential risks and market impact
Australia leads the world in rooftop solar, yet renters, apartment dwellers and low-income households remain excluded from many of the benefits. Ausgrid’s proposed Community Power Network trial seeks to address this gap by installing and operating shared solar and batteries, with returns redistributed to local customers. While the model could broaden access, it also challenges the long-standing separation between monopoly networks and contestable markets, raising questions about precedent, competitive neutrality, cross-subsidies, and the potential for market distortion. We take a look at the trial’s design, its domestic and international precedents, associated risks and considerations, and the broader implications for the energy market.
Competition a key to VPP development: ACCC report
The Australian Competition and Consumer Commission’s most recent report on the electricity market provides good insights into the extent of emerging energy services such as virtual power plants (VPPs), electric vehicle tariffs and behavioural demand response programs. As highlighted by the focus in the ACCC’s report, retailers are actively engaging in innovation and new energy services, such as VPPs. Here we look at what the report found in relation to the emergence of VPPs, which are expected to play an important and growing role in the grid as more homes install solar with battery storage, the benefits that can accrue to customers, as well as potential areas for considerations to support this emerging new market.
Send an email with your question or comment, and include your name and a short message and we'll get back to you shortly.