

by Carol Tran
Western Australia’s dramatically changing electricity consumption
Recent data from the Australian Energy Market Operator (AEMO) shows that demand and consumption in Western Australia has changed markedly from last year. AEMO’s 2020 Wholesale Electricity Market Electricity Statement of Opportunities (WEM ESOO)[i], forecasts electricity demand and operational consumption across a range of scenarios in Western Australia over an outlook period of 10 years.
Below we take a look at some highlights from the report.
Peak demand
For the first time, the 10% probability of exceedance (POE) peak demand is forecast to fall. This refers to the grid demand, i.e. net of behind the meter rooftop photovoltaic (PV) generation. The 10% POE is the demand level that is expected to be exceeded only once every 10 years and is often taken as something of a benchmark that a highly reliable power system is expected to supply. Since the 1990s, WA's 10 per cent POE demand has grown strongly due to:
- population growth
- industrial growth, and
- widespread take-up of domestic air-conditioning.
Figure 1 shows the difference between the 2019 and 2020 report’s peak demand outlook in WA. The 2019 WEM ESOO forecast an average annual growth of 0.4 per cent, while this year's report forecasts peak demand to decrease at an average annual rate of 0.2 per cent over the 10-year outlook period.
This is both because the drivers of growth described above have eased in WA, and because the rapid take up of PV continues to trim the peak demand which historically occurred mid-afternoon on a hot weekday. This trimming is already pushing back the time of peak net demand close to sunset, so the effect is diminishing.
From 2024-25 capacity year, this time shifting causes the effect of PV growth on peak demand to saturate, but the 10% POE peak demand is forecast to flatten rather than grow again, this is helped by other distributed energy resources (DER) coming into play, such as batteries, which will act to trim the peak after sunset.
Figure 1: 2019 and 2020 WEM ESOO’s peak demand forecasts (MW) for different weather scenarios

Source: AEC’s analysis on AEMO’s 2019 and 2020 WEM ESOO
Growth of rooftop solar
The capacity of rooftop PV systems installed behind the meter reached over 1,300MW, as of February 2020. Figure 2 illustrates a record of behind-the meter PV generation (1,537GWh) for the 2018-19 financial year. This is a record of 8.1 per cent of the SWIS underlying demand, compared to 6.1 per cent in 2017-18.
Figure 2: SWIS operational consumption and behind-the-meter PV generation (GWh) and capacity (MW)

Source: AEC’s analysis on 2020 AEMO ESOO
Though the behind-the-meter installed capacity is “larger than Muja CD (the largest power station in the SWIS)” which has a total capacity of 854MW, they have quite different production characteristics. A 1GW dispersed installation of rooftop PV with a 15 per cent load factor will provide the same yearly energy output as a 215MW coal-fired plant of 70 per cent load factor. Muja CD’s FY2018-19 annual generation is 3,755GWh while rooftop PV generated 1,537GWh of electricity (854MW compares to 1,164MW). This is why the share of PV’s energy in the graph above (orange) has been unimpressive compared to its share of WA’s capacity (grey line).
Reserve capacity
Unlike the energy-only National Electricity Market (NEM) where generators recover their capacity costs through energy-price volatility and selling hedge contracts, the Western Australian Wholesale Electricity Market (WEM) has a centrally managed Reserve Capacity Mechanism (RCM). Large-scale generators are issued ‘capacity credits’ for the generation capacity they can provide to the market at peak times. In other words, generators are paid to exist throughout the year in case they are needed for peak demand.
As a result of this, energy price volatility is not considered necessary, and generators are restricted in the prices they may bid in by the energy market by the maximum Short Term Energy Market price which was discussed in a recent EnergyInsider[ii].
Figure 3: Historical and Forecast reserve capacity requirement and certified capacity (capacity credits)
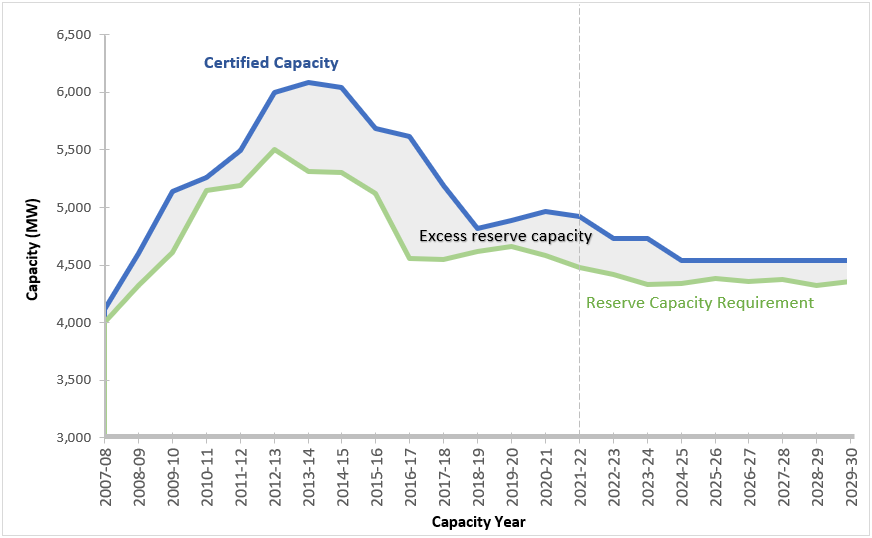
Source: AEC’s analysis on WEM ESOO 2005 to 2020
Historically, the RCM shared a fixed amount of money across all eligible providers in proportion to the amount of capacity they were deemed as bringing to the peak demand. This could include, for example, gas-fired peaking generation, that might be deemed to have full capacity, demand-side interruption, or large-scale renewables who would be deemed at a lower level due to their intermittency.
The total amount of deemed capacity is shown in the blue line of figure 3. The green line is the amount of reliable capacity that AEMO has specified as necessary to meet 10% POE demand forecast plus a reserve margin to cover the loss of the largest conventional large generating unit. The optimal outcome is when these two lines match.
In the middle of the last decade the RCM appeared to over-signal the value of capacity and an inefficient excess of supply emerged (see figure 3). Since then significant changes were applied to the RCM that reduced the amount paid to demand-side (and tightened eligibility) and subsequently a sloping payment curve is being introduced such that during future surpluses new capacity will receive lower RCM payments.
In the 2017-18 RCM year, when the demand-side RCM changes were introduced, demand-side’s share of the RCM reduced by 425MW. The following year Synergy’s supply fell by 380MW as surplus generation was closed[iii]. As such, the surplus capacity dropped from 23.3 per cent to 4.3 per cent in 2018-19. In September 2019, a total of 4,925MW of Capacity Credits was assigned to meet the Reserve Capacity Requirement (RCR) of 4,482MW for the 2019 Reserve Capacity Cycle in relation to the 2021-22 Capacity Year, representing a 9.9 per cent excess capacity level, much closer to optimum.
Minimum demand
PV is growing at such a rate for the WEM, that managing peak demand is becoming less of a challenge than managing minimum net grid demand.
Prior to 2017-18, daily minimum demand occurred during overnight or early morning periods when residential and commercial energy use was typically low. In the most recent three years, all record daily minimums have occurred during daytime hours that corresponded with periods of high behind-the-meter PV generation. The most recent minimum demand on 4 January 2020 is the lowest observed at 1,138MW. It is estimated an 896MW of PV generation had displaced the underlying demand. This is actually a slower rate of decline of minimum demand than has already happened in South Australia and was discussed in a recent EnergyInsider[iv], however the challenges for WA are more acute due to the lack of interconnection to other regions that can absorb the surplus and provide support.
Figure 4: 50 POE forecast minimum demand and actuals under different growth scenarios, 2012-13 to 2024-25
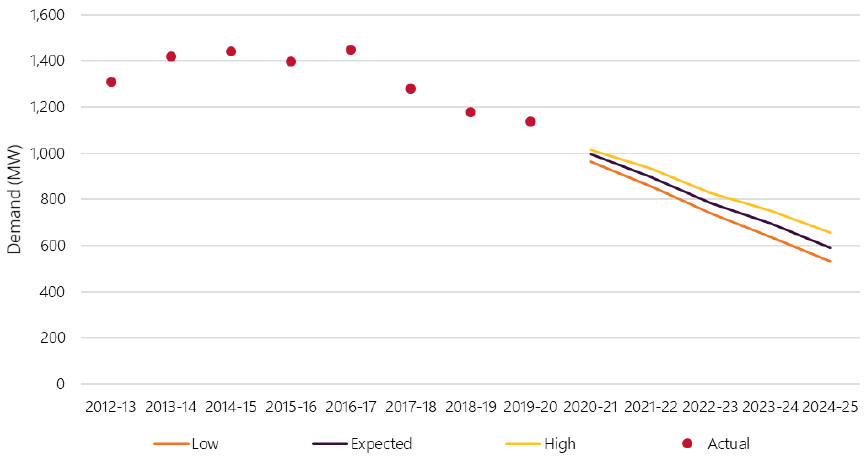
Source: AEMO’s 2020 WEM ESOO
Minimum demand forecasts have been included in the 2020 WEM ESOO for the first time. Across different cases, the report forecasts a five-year annual average decline rate from 10.3 per cent to 13.8 per cent.
This level of demand decrease points to the system security threshold of 700MW quickly being breached. Under these circumstances, the first response would be to constrain off non-synchronous generation and constrain on synchronous generation to prevent system collapse. This would have dire consequences for households and businesses across the SWIS. A 2019 report by AEMO noted that “if the entirety of the shortfall below the 700MW system security threshold was required to be met by the shedding of DER (when the ability to constrain on synchronous generation is limited), 48,000 households would need to be disconnected. In 2022, up to 58,000 households may experience interrupted electricity supply for a DER shedding event; in 2025, this increases to 252,000 households.”[v]
Conclusion
As WA sees increasing levels of non-traditional generators coming online, keeping the power system secure and reliable becomes a great concern to operators for this stand-alone market. Initiatives that reduce behind-the-meter PV generation or increase demand during times of reduced load, or the introduction of synchronous condensers (investments in reactors, storage such as batteries, voltage and frequency control equipment, dynamic under frequency load shedding) will be critical to maintain power system security.
[i] 2020 Electricity Statement of Opportunities - A report for the Wholesale Electricity Market, AEMO June 2020
[ii] https://www.energycouncil.com.au/analysis/setting-the-mark-why-price-limits-should-change-in-wa/
[iii]https://www.erawa.com.au/cproot/17086/2/Annual%20WEM%20report%20to%20the%20Minister%20for%20Energy%20for%20period%20to%20June%202016%20.pdf page 32
[iv] https://www.energycouncil.com.au/analysis/south-australia-faces-solar-trade-off/
[v] See p25, Integrating Utility Scale Solar and Distributed Energy Resources in the SWIS
Related Analysis
Data Centres and Energy Demand – What’s Needed?
The growth in data centres brings with it increased energy demands and as a result the use of power has become the number one issue for their operators globally. Australia is seen as a country that will continue to see growth in data centres and Morgan Stanley Research has taken a detailed look at both the anticipated growth in data centres in Australia and what it might mean for our grid. We take a closer look.
Energy Dynamics Report - A Tale of Minimum Operational Demand and Wholesale Price declines
The third quarter saw significant price declines compared with the corresponding quarter in 2022 right across the NEM. At the same time with increased output from solar and wind generation inin Queensland’s case, minimum operational demand records were set or equaled in every region. The quarter also saw the highest-ever level of negative price intervals with all regions showing an increase. We dive in to the pricing and operational demand detail of AEMO’s Q3 Quarterly Energy Dynamics Report.
Data centres: A 24hr power source?
Data centres play a critical role in enabling the storage and processing of vast amounts of online data. However they are also known for their significant energy consumption, which has raised concerns about their environmental impact and operating costs. But can data centres be fully sustainable, or even a source of power?
Send an email with your question or comment, and include your name and a short message and we'll get back to you shortly.