
by AEC
The highs of VWA prices
In the past two quarters the Volume Weighted Average (VWA) prices across the National Electricity Market (NEM) have shown a substantial increase, with the outcome for quarter two described as “truly remarkable”[i]. So what is driving this shift in VWA prices? There appear to be a range of factors - from interconnector outages, plant closures, increased industrial demand and decreased reliability – playing varying roles in different regions of the NEM over the first half of 2016.
Figure 1 shows the quarterly VWA prices in the NEM since 1 July 2014.
Figure 1: Quarterly VWA prices
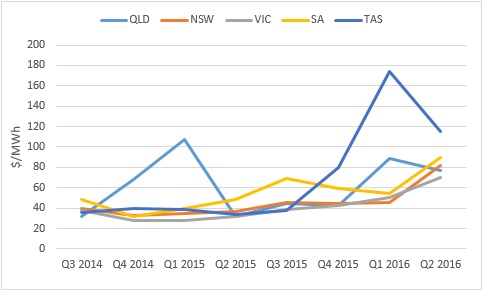
Source: AER, Australian Energy Council analysis of NEM-Review data
The largest price rise is seen in Tasmania. The increase in price is due to the extended Basslink interconnector outage and the coincidental depleted dam levels which restricted the availability of hydro generation. In response, Tasmania introduced diesel-fired generators, which were brought to Tasmania from the mainland, and reinstated the Tamar Valley combined cycle gas turbine. During this time, other measures taken included the reduction of industrial load from large users such as Bell Bay aluminium. Figures 2 and 3 show imports for Tasmania and Victoria for the 2015-16 financial year, which highlight the impact of Tasmania’s energy situation during this period.
Figure 2: Tasmanian import from Victoria
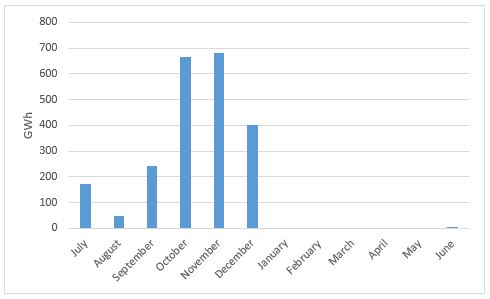
Source: Energy Council analysis of NEM-Review data
Figure 3: Victorian imports
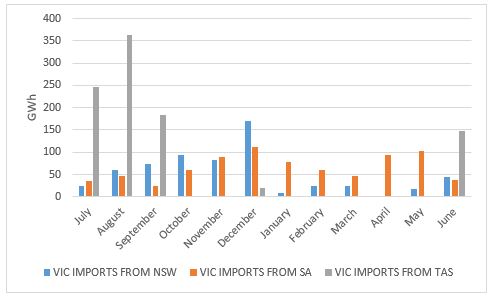
Source: Australian Energy Council analysis of NEM-Review data
In June, Basslink came back online. Interestingly, Tasmania exported 246 GWh and imported 161 MWh for the month. The exports followed increased rainfall during May and June led to an increase in overall dam storage levels. The increased storage levels led to smaller dams generating at maximum capacity to minimise the amount of spilling and waste of rainfall inflows. The associated surplus electricity generation was exported to Victoria[ii].
Baseload prices
The announced closure of Northern power station led to increased wholesale prices in South Australia and, to a lesser extent, Victoria. The market for future contracts is extensive and ranges in types of contracts (baseload, peak, cap) and timing of contracts (quarters, calendar year, financial year, month). For simplicity, Figure 4 shows the change across the NEM for calendar year 2017 future baseload prices since July 2015.
Figure 4: Future Baseload Wholesale prices CY 2017
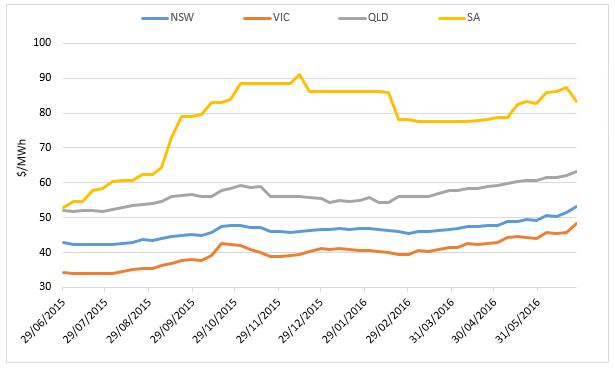
Source: NEM-Futures
The recent high prices in South Australia are expected to continue in the future with the change in the state’s energy mix. Spot prices act as a signal for generators, where the price paid to all generators is the price of the highest bidding generator which is dispatched in the market. As the majority of energy is contracted before the transaction takes place, spot prices do not represent the profit of a generator. Instead they indicate the marginal cost of the most expensive generator being turned on. Prolonged high prices act as a signal for new entrants to enter the market.
What is causing the discrepancy between baseload and spot market prices?
Ageing infrastructure, decreased utilisation factors for thermal power stations since 2008-09 and increasing reliability issues are leading to increased unit outages and unit trips, which ultimately lead to higher prices. Table 1 shows the increasing reliability issue facing New South Wales. Data has been obtained from a single power station located on the New South Wales Central Coast.
Table 1: Increased reliability issues in New South Wales
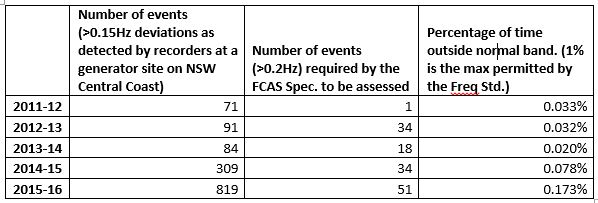
Source: Australian Energy Council, Member Company
Intermittent generation offers no inertia in the power system. The rise and fall of generation can cause frequency deviations as seen in Table 1. The increased number of frequency deviation events has led to increased stress on thermal power stations. Stations must heat or cool to correct frequency deviations and ensure reliability in the system. Heating and cooling causes stress on power stations, which ultimately leads to an increased number of unit trips.
Decreased utilisation
The NEM experienced unprecedented growth up until 2008-09. Since then, a mixture of factors which have been well documented have led to decreased demand and an oversupply of generation capacity. A direct result of decreased demand and oversupply is decreased utilisation factors and revenues for power stations.
High gas prices
A cold winter and the commissioning of the 5th LNG train in Queensland are factors contributing to the increase in gas prices in Sydney, Adelaide and Queensland. Prices in Sydney reached above $20/GJ for the majority of last week. To put this into perspective, the average ex post price in Sydney for 2015 was $4.10/GJ. Figure 5 shows the 30 day moving average ex post price in the aforementioned regions since January 2015.
Figure 5: 30 day moving average gas prices
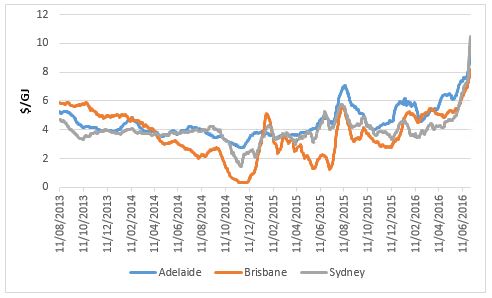
Source: Australian Energy Council analysis of AEMO data
The new high reached for the 30 day average gas price is an indication that supply is very tight. Continued high prices would encourage increased exploration for natural gas. However, while moratoriums and restrictions are still in place for unconventional gas sources in some jurisdictions across Australia, it is hard to see where new gas reserves will be found. This is likely to have a direct effect on gas-fired generation and spot prices across the NEM for the foreseeable future.
[i] WattClarity, Reviewing Q2 prices – short-term excursion, or more systemic change in pricing patterns? , http://www.wattclarity.com.au/2016/07/reviewing-q2-prices/
[ii] http://www.hydro.com.au/about-us/news/2016-05/tasmania-currently-completely-renewable
Related Analysis
Is increased volatility the new norm?
This year has showcased an increased level of volatility in the National Electricity Market (NEM). To date we have seen significant fluctuations in spot prices with prices hitting both maximum price caps on several occasions and ongoing growth in periods of negative prices with generation being curtailed at times. We took a closer look at why this is happening and the impact this could have on the grid in the future.
Is there a better way to manage AEMO’s costs?
The market operator performs a vital role in managing the electricity and gas systems and markets across Australia. In WA, AEMO recovers the costs of performing its functions via fees paid by market participants, based on expenditure approved by the State’s Economic Regulation Authority. In the last few years, AEMO’s costs have sky-rocketed in WA driven in part by the amount of market reform and the challenges of budgeting projects that are not adequately defined. Here we take a look at how AEMO’s costs have escalated, proposed changes to the allowable revenue framework, and what can be done to keep a lid on costs.
Retail protection reviews – A view from the frontline
The Australian Energy Regulator (AER) and the Essential Services Commission (ESC) have released separate papers to review and consult on changes to their respective regulation around payment difficulty. Many elements of the proposed changes focus on the interactions between an energy retailer’s call-centre and their hardship customers, we visited one of these call centres to understand how these frameworks are implemented in practice. Drawing on this experience, we take a look at the reviews that are underway.
Send an email with your question or comment, and include your name and a short message and we'll get back to you shortly.