The emergence of a new energy market dynamic
Discussion about the emergence of a new energy market dynamic and whether there is a need to address it, has recently developed in the public arena.
There has been significant attention on negative price events in the National Electricity Market (NEM) and the potential impact on the business model of traditional generators.
Most recently, the Australian Energy Market Operator (AEMO) flagged the need to consider market rule changes to recognise the types of resources and “usefulness”, or dispatchability, of generation needed to run the electricity grid[i]. And the chair of the Energy Security Board (ESB), Kerry Schott, also entered the public discussion earlier this week[ii].
At a broader level, the ESB has released its issues paper on the post-2025 market design, which also considers what range of approaches might be needed to integrate higher proportions of renewable generation into the NEM.
So what is it all about?
Energy markets around the world fall broadly into two categories:
- “Energy-only” markets such as the NEM, where generators receive the value for their production of energy and the capacity to provide it from the one energy price; and,
- “Energy and Capacity markets” such as the WA’s Wholesale Electricity Market (WEM), where generators receive a return for their capacity from one revenue stream and another for their efficient production of energy.
There is a common misconception, possibly arising from these simple terms, that in energy-only markets all generators are paid the same for all the electrons they produce. That would certainly be problematic as different generators have very different strengths and weaknesses: gas, coal, hydro, wind and solar. And even within technology classes, some generators are more dependable than others. Fortunately the market inherently recognises this, and certainly does not pay equal reward for unequal service. Yes, it pays generators the same price, but only at the location and time they are generating.
Time is the critical matter here. Customers will want a lot more electricity on a hot February evening than they would at noon on Good Friday. Reflecting that, prices are completely different at those two times. The market will pay a generator that is capable of running on a hot summer’s night many times more than one that is only capable of running at other times.
Generators are not equally useful, nor are they equally paid
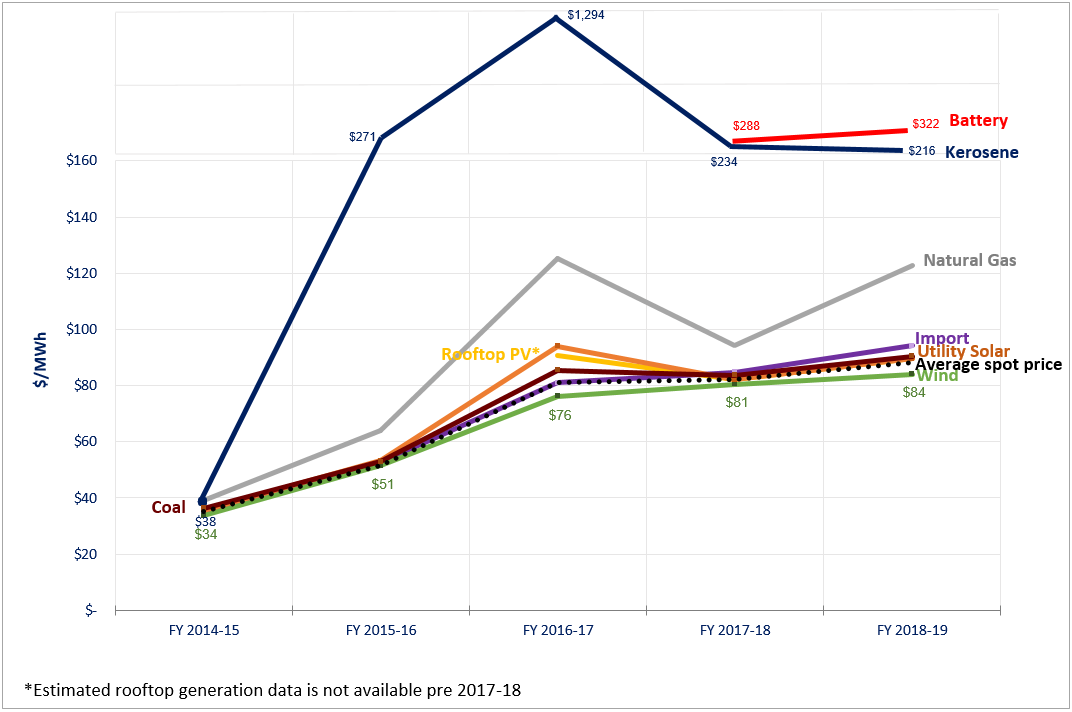
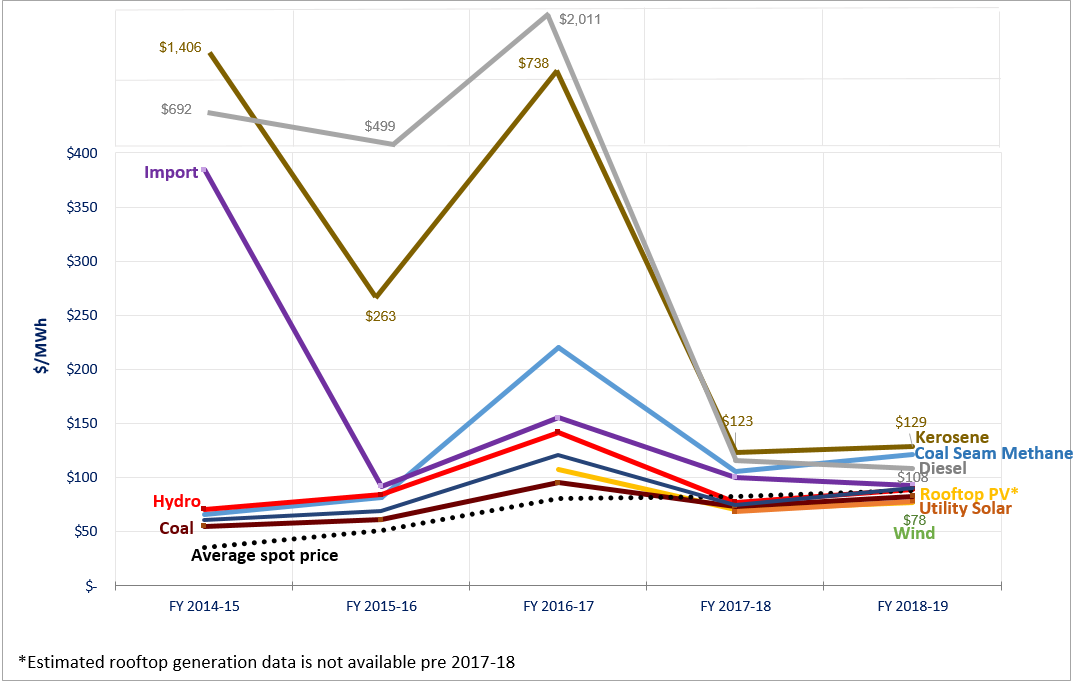
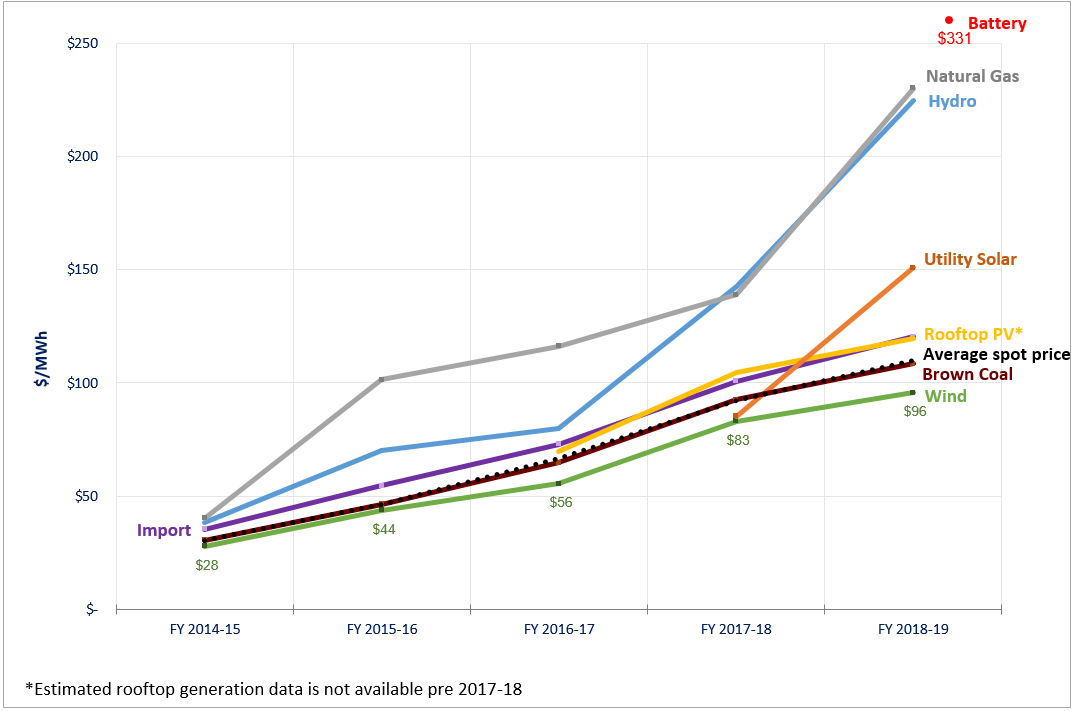
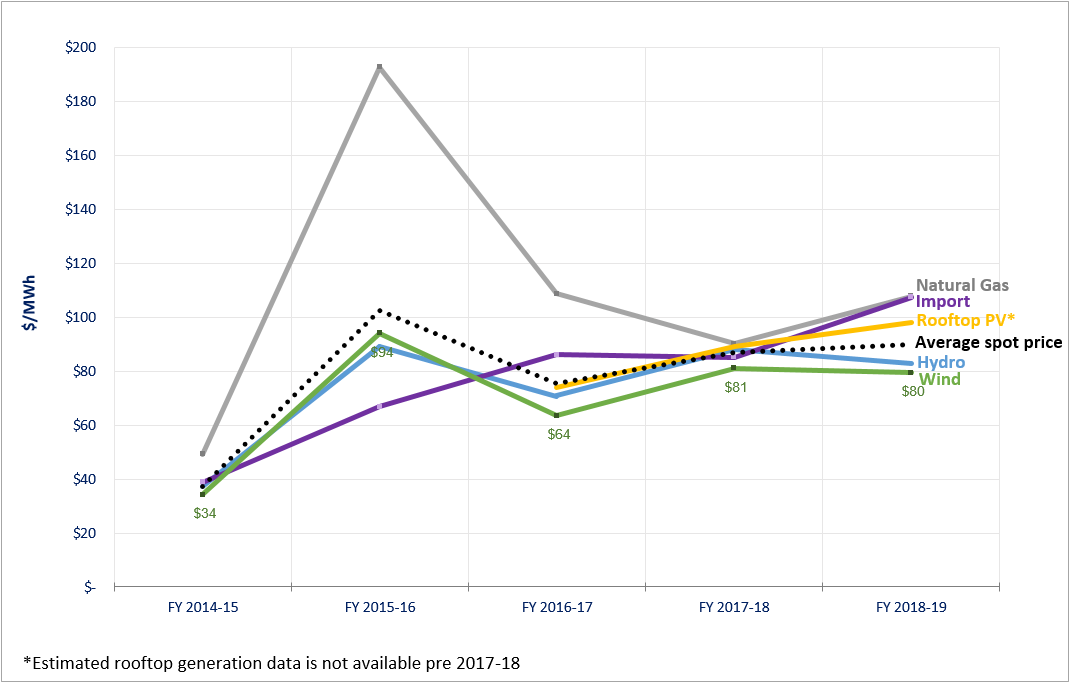
These effects can be observed in the following data. Different technologies have received considerably different weighted average payments due to the times that they are running. Those that respond to the needs of the system tend to receive a premium to the simple time-weighted average, whilst those that tend to generate most at times of surplus tend to receive a discount.
Table 1: Premiums and discounts to the average spot price received by South Australian technologies in FY2018-19
 (Colour code: Red: lower price / Green: premium price compared to average spot price). Source: Australian Energy Council’s Analysis
Note how in South Australia peaking plants (OCGT) tend to receive 13 multiples of the average price (see table 1). That is fair enough, they are coming on only at those times when the system needs them the most. And, by making profits at those brief times, they can go some way to covering their costs of remaining available to provide critical capacity to customers.
At the same time note how South Australian wind generation is earning 24 per cent less than the average. This can also be easily explained: Because wind is now so common in South Australia, when the wind blows hard there will be excess supply and prices will be low and sometimes negative. That is also fair enough – there is certainly value in their produced energy which avoids having to burn fossil fuels, but its value is less than other sources because of its intermittency and self-correlation. This is also a signal that wind developers will be taking into account – as the effect grows they will consider developing elsewhere where the effect is less severe.
The difference in prices received by different technologies are shown below for the past 10 years. The picture has changed as the supply mix has changed, note how the SA wind discount has progressively grown, although it eased somewhat in 2017-18 after transmission expansion allowed more surpluses to be exported. Recent system security restrictions on very high regional wind outputs would have also lessened the effect.
At the same time the NSW wind discount remains less severe as that technology has a lower relative penetration in that region, so there is a lower impact from its self-correlated output.
Table 2: Premiums and discounts to the average spot price received by technologies over the past ten financial years
South Australia
New South Wales 
Queensland 
Victoria 
Tasmania 
(Colour code: Red: lower price / Green: premium price compared to average spot price) / Source: Australian Energy Council analysis
The price cap and the contract market
A key factor in the NEM’s favour is its very high price cap of $14,700/MWh. This is crucial as a lower price cap would cruel the livelihood of those generators providing the firm capacity that is so critical to meet customers’ demands of supply continuity. Many other electricity markets, due to political concerns, do not enjoy such a freedom and have no choice but to find another way to pay for this firm capacity.
The data presented here broadly shows how the energy-only market pays differently for different service, but it is only the “spot” market settled by AEMO. Behind these charts is another market – the “contract” market where generators and retailers hedge these spot prices over time. Whilst incomes from the contract market broadly follow these spot market figures, the contract market can also provide some generators an additional premium thanks to their ability to transfer risks from retailers. In return for protecting retailers from the most extreme prices, a hedge contract is worth both the expected spot price plus a premium for removing extreme outliers – a kind of insurance value. The net result is that the premiums received by the firmer generation technologies in the contract market are somewhat higher again than those presented here from the spot market.
Conclusion
The NEM’s energy-only market certainly attempts to recognise and reward generators for providing the firm capacity that customers need.
But this market design is not necessarily the long-term answer for the NEM. In it, investors are heavily exposed to the market’s swings and roundabouts, including those created through various distortions, such as subsidised competition and changes to government policy. Unfortunately there is no sign of these distortions and uncertainties ending anytime soon.
For these reasons the ESB is reviewing this design. They may well conclude in favour of a design that exposes investors less to those distortions and provides stakeholders more confidence in how long-term supply will be delivered.
But such a conclusion would not be a repudiation of the academic basis of the energy-only market. Instead it would be a pragmatic reflection that its academic perfection may not sit easily within an extremely imperfect investor environment.
Chart 1: Volume-weighted average prices of different plant types and time-weighted average spot price (dash line) since FY2014-15
South Australia 
New South Wales 
Queensland 
Victoria 
Tasmania  Source: Australian Energy Council analysis
[i] ”Negative power prices pushing case for reform”, AFR Weekend, 7 September 2019
[ii] “Schott backs coal to stay in the NEM”, Australian Financial Review, 11 September 2019
Related Analysis
A farewell to UK coal
While Australia is still grappling with the timetable for closure of its coal-fired power stations and how best to manage the energy transition, the UK firmly set its sights on October this year as the right time for all coal to exit its grid a few years ago. Now its last operating coal-fired plant – Ratcliffe-on-Soar – has already taken delivery of its last coal and will cease generating at the end of this month. We take a look at the closure and the UK’s move away from coal.
Retail protection reviews – A view from the frontline
The Australian Energy Regulator (AER) and the Essential Services Commission (ESC) have released separate papers to review and consult on changes to their respective regulation around payment difficulty. Many elements of the proposed changes focus on the interactions between an energy retailer’s call-centre and their hardship customers, we visited one of these call centres to understand how these frameworks are implemented in practice. Drawing on this experience, we take a look at the reviews that are underway.
Delivering on the ISP – risks and opportunities for future iterations
AEMO’s Integrated System Plan (ISP) maps an optimal development path (ODP) for generation, storage and network investments to hit the country’s net zero by 2050 target. It is predicated on a range of Federal and state government policy settings and reforms and on a range of scenarios succeeding. As with all modelling exercises, the ISP is based on a range of inputs and assumptions, all of which can, and do, change. AEMO itself has highlighted several risks. We take a look.
Send an email with your question or comment, and include your name and a short message and we'll get back to you shortly.


