South Australia's power shock delivers important lessons
Slow population growth and a moderating resources sector is slowing South Australia’s economic growth (unemployment has been hovering around 7 per cent for the last 12 months[iii]) and energy consumption. Against this backdrop, it is understandable that when average wholesale prices in the State reached 4.5 times their long run average[iv], and some trading periods saw prices of $9,000 MWh, South Australians began asking ‘why’.
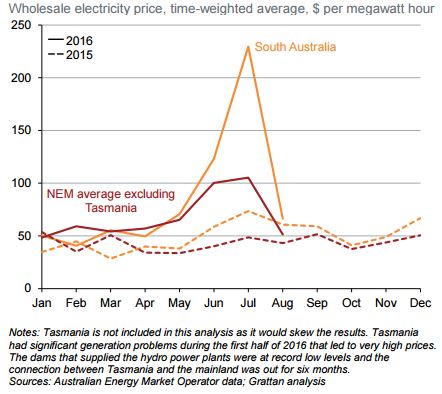
This week, the Grattan Institute presented a useful report outlining the drivers of the volatile prices that were seen in South Australia earlier this year[v]. Figure 1 shows that wholesale electricity prices spiked during July 2016. The Grattan Institute estimates that average wholesale prices in South Australia of $229 were three times higher than the same time the previous year (Figure 1). What has changed?
Figure 1: Wholesale prices in South Australia and the NEM average, year to August 2015 and 2016

Source: Australian Energy Market Operator data; Grattan analysis, 2016
South Australia is discovering that an energy supply portfolio based on very large amounts of renewable generation is not without its challenges. In May 2016, the State’s only coal fired power plant closed, leaving the State mostly reliant on wind and gas, and subject to the availability of wind energy, due to its intermittent nature. The shifting fundamentals in South Australia were even more apparent when a unique set of circumstances combined to produce the high price spikes in winter 2016.
Generally, prices increase as supply becomes relatively scarce, which signals to other producers to enter the market and increase supply. Over the medium to long term, new producers enter the market and higher supply moderates prices until a new equilibrium is met. However, the Grattan Institute’s analysis points to policy interventions in the market, including the Renewable Energy Target, undermining the long term market signals.
South Australia’s high June and July electricity prices were driven by supply issues, electricity demand was similar to the previous year. The Australian Energy Regulator (AER) investigated the July 2016 price drivers and found that the lack of supply of generation was due to a number of unusual events combined, which resulted in much lower supply than expected[vi]. These price events are emblematic of the challenges and trade-offs which present themselves on the path to lower emissions. The Grattan Institute outlines the four price drivers in South Australia in July, being:
- Low wind generation (scarcity in supply due to intermittent generation).
- Limited interconnection with Victoria (scarcity in supply due to upgrades).
- Lack of low cost alternatives in the region.
- High domestic gas prices (due to high demand for gas for export).
The intermittent nature of wind energy
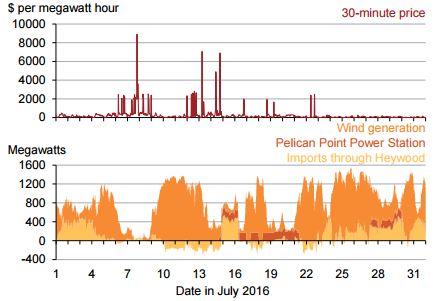
While reasonably consistent with market forecasts, wind output in July was only 270 MW—57 per cent below the historical average for that month[vii]. Unlike traditional generation such as hydro, coal or gas fired plant, wind generation is completely dependent on weather events and its production cannot be predicted with perfect accuracy. In July 2016, unexpectedly low wind generation coincided with peak demand in South Australia. In the peak demand periods, prices increased reflecting scarce supply in the region.
Figure 2: SA Wholesale prices by interval and power supply by source

Source: Grattan, 2016
Price volatility is an important part of the energy-only market design because it signals to generators when to increase or decrease supply, quickly. With a high share of intermittent generation, research shows that volatility of supply may require changes to price caps to provide a signal to increase supply when needed. The price cap (maximum price) is currently set at $14,000 MWh. Under a 100 per cent renewable scenario, a maximum price cap of between $60,000 to $80,000 MWh may be required to bring generation into the market when supply is tight. This means that wholesale prices could fluctuate between negative prices to $80,000 MWh[viii].
Limited ability to import from other regions
The second driver that limited electricity supply in South Australia was the interconnection with Victoria. South Australia’s low wind generation coincided with reduced ability to source low price electricity from other regions. The Grattan Institute highlighted that South Australia is only connected to generation in one other state, and this is in stark contrast to other regions globally with high shares of intermittent generation. Like South Australia, Denmark also sources around 40 per cent of its electricity generation from intermittent wind power[ix]. The Danish energy system can cope with the variability and uncertainty of its large share of wind power due to its interconnection with Germany, Norway and Sweden.
Through June and July 2016, planned work to upgrade the Heywood interconnector between Victoria and South Australia frequently reduced South Australia’s import capacity. The major upgrade was announced to the market well in advance (in 2015) however, its impact on Heywood’s operating capability was at times not clear. At times, AEMO put in place constraints to allow the work to go ahead. The constraints reduced the import limit into South Australia and limited generation in the south-east of the State.
South Australia is reliant on gas and wind generation- one of which is intermittent
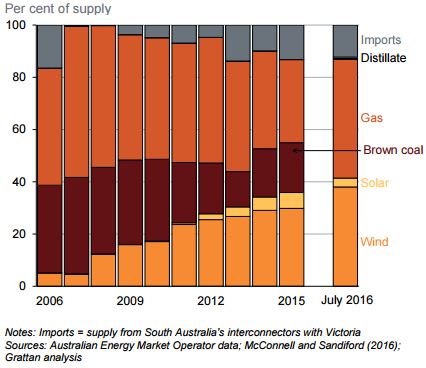
The Grattan Institute identifies that the third factor driving up spot prices came from a lack of supply alternatives within the State. The AER confirms that South Australia is now dependent on just two fuel types for over 85 per cent of its generation – one of which is intermittent. After the closure of Northern Power Station in May 2016, there are now just a few low cost supply alternatives available (Figure 3). Gas plant such as Dry Creek or Snuggery are designed to be highly flexible and fast responding, so they are operated at much higher cost than baseload plant. Diesel, hydro and solar power are all relatively high cost supply due to fuel and technology costs. Under the current policy settings, the incentives created are not driving efficient decisions to fill the gaps of intermittent generation.
Figure 3: South Australia’s electricity supply by fuel to July 2016

Source: Australian Energy Market Operator data; Grattan analysis, 2016
The Grattan Institute identifies the flaw in the current regime and need for reform. In the short run, wind generation suppresses the wholesale price below the operating costs of both wind and non-wind generators.
“If a wind generator chooses not to generate, it will effectively lose money since it will not generate a subsidy under the Federal Government’s Renewable Energy Target (RET) scheme... This is why, at times, a wind generator may bid into the market at a negative price – it is prepared to pay the market to take its electricity because it knows it will get revenue from the subsidy.”[x]
Over the long term, this signals to investors that new generation is not needed in the market and a new investment will not generate sufficient revenue. However, at times when there is no wind generation, prices are likely to be very high reflecting the scarce number of generators left in the market. Investment in new generation that can balance the peaks and troughs of intermittent generation, needs the right price signals.
Tight gas supply on the East Coast
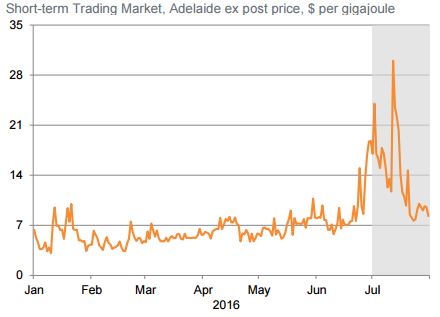
The fourth factor identified by the Grattan Institute is tight gas supply and high gas prices on the east coast of Australia. In July 2016, wholesale gas prices in South Australia spiked to more than double their levels over the first half of 2016 (Figure 4). In addition to the high fuel costs, gas generators face high transport costs. Energy Quest has outlined the difficulty and high cost to transport gas for intermittent generation (not on long term contracts)[xi].
Figure 4: Wholesale gas prices in the first half of July 2016

Source: Grattan, 2016
With Victoria continuing to impose restrictions on exploration and drilling for onshore gas[xii], the tight gas supply in the east coast is unlikely to ease. Increasing the supply of gas, by allowing expansion of existing conventional gas and unconventional gas production in Victoria and increasing production in the other states, will help to combat the price rise. Reforms for the transport of gas are currently underway in light of the findings of two inquiries into the east coast gas market by the Australian Competition and Consumer Comission (ACCC) and the Australian Energy Market Commission (AEMC).
In its analysis of the July 2016 high price events in South Australia, the Grattan Institute highlights the need for a credible, predictable climate change policy to achieve effective emissions reduction. The RET was not designed to be the only policy to reduce emissions in the electricity sector. Accordingly, the high prices seen in South Australia do not signal the failure of the design of the national electricity market in the 1990s. Rather, it is the result of a decade of state and federal government intervention into an extremely complex system. The Grattan Institute concludes that high prices and volatility are likely to continue for some time, so recognising the energy transition and its costs are important to create awareness about price changes.
[i] Australian Bureau of Statistics, 2016, Australian National Accounts, cat no 5206.0, http://www.abs.gov.au/ausstats/abs@.nsf/mf/5206.0
[ii] Australian Bureau of Statistics, 2016, Australia’s demographic statistics, cat no 3101.0, http://www.abs.gov.au/ausstats/abs@.nsf/mf/3101.0
[iii] Australian Bureau of Statistics, 2016, Labour Force Statistics, cat no 6202.0, http://www.abs.gov.au/AUSSTATS/abs@.nsf/DetailsPage/6202.0Aug%202016?OpenDocument
[iv] Australian Energy Regulator, 2016, Winter energy prices 2016, http://aer.gov.au/communication/winter-energy-prices-2016
[v] Grattan, 2016, Keeping the lights on, http://grattan.edu.au/wp-content/uploads/2016/09/877-Keeping-the-lights-on.pdf
[vi] Australian Energy Regulator, 2016, Prices above $5000/MWh - 7 July 2016 (SA), http://aer.gov.au/wholesale-markets/market-performance/prices-above-5000-mwh-7-july-2016-sa
[vii] Australian Energy Regulator, 2016, Winter energy prices 2016, http://aer.gov.au/communication/winter-energy-prices-2016
[viii] Riesz, J., Gilmore, J. and MacGill, I., 2016, Assessing the viability of Energy-Only Markets with 100% Renewables, Economics of Energy & Environmental Policy, 5(1)
[ix] EU Commission, 2016, Energy datasheets: EU-28 countries – June update, https://ec.europa.eu/energy/en/data-analysis/country
[x] Grattan Institute, 2016, Keeping the lights on, P8, http://grattan.edu.au/wp-content/uploads/2016/09/877-Keeping-the-lights-on.pdf
[xi] EnergyQuest, 2016, May EnergyQuarterly, http://www.energyquest.com.au/insightsandanalysis.php?id=255
[xii] Victorian Department of Economic, Jobs, Development, Water and Resource, 2016, Current status and allowable activities, http://onshoregas.vic.gov.au/regulation/current-status-and-allowable-activities
Related Analysis
Nuclear Fusion Deals – Based on reality or a dream?
Last week, Italian energy company ENI announced a $1 billion (USD) purchase of electricity from U.S.-based Commonwealth Fusion Systems (CFS), described as the world’s leading commercial fusion energy company and backed by Bill Gates’ Breakthrough Energy Ventures. CFS plans to start building its Arc facility in 2027–28, targeting electricity supply to the grid in the early 2030s. Earlier this year, Google also signed a commercial agreement with CFS. These are considered the world’s first commercial fusion-power deals. While they offer optimism for fusion as a clean, abundant energy source, they also recall decades of “breakthrough” announcements that have yet to deliver practical, grid-ready power. The key question remains: how close is fusion to being not only proven, but scalable and commercially viable, and which projects worldwide are shaping its future?
Community Power Network Trial: Potential risks and market impact
Australia leads the world in rooftop solar, yet renters, apartment dwellers and low-income households remain excluded from many of the benefits. Ausgrid’s proposed Community Power Network trial seeks to address this gap by installing and operating shared solar and batteries, with returns redistributed to local customers. While the model could broaden access, it also challenges the long-standing separation between monopoly networks and contestable markets, raising questions about precedent, competitive neutrality, cross-subsidies, and the potential for market distortion. We take a look at the trial’s design, its domestic and international precedents, associated risks and considerations, and the broader implications for the energy market.
Winter Bills: Is it cheaper to heat your house with gas or electricity?
As gas and electricity prices continue to fluctuate across Australia’s east coast, households and businesses are facing rising winter energy costs and growing uncertainty. Seasonal demand, household gas consumption, and the efficiency of electric heating systems, particularly when paired with rooftop solar, are playing an increasingly important role in shaping energy bills. Drawing on data from the Australian Energy Council’s Solar Report Q2 2025, this article explores how these factors affect costs and highlights potential savings for households of different sizes.
Send an email with your question or comment, and include your name and a short message and we'll get back to you shortly.


