Renewables in the NEM: Are they leading to price extremes?
With the ongoing growth of renewables in Australia there has been speculation of the overall impact this will have on an energy-only market like the National Electricity Market (NEM) and in particular, its potential influence on spot prices.
Large-scale renewables now make up 32 per cent of generation capacity in the NEM (excluding rooftop solar) and represents more than 20 per cent of output. The Australian Energy Market Operator (AEMO) forecast in its latest Integrated System Plan that Australia will need 26-50GW of additional grid-scale renewables by 2040[i].
The potential impact of renewables on NEM spot prices has continued to be the subject of much discussion[ii]. A new paper by energy market economists Dr Alan Rai and Oliver Nunn[iii] assesses the impact of increasing renewables on electricity spot price extremes in the NEM.
Below we take a look at some of the key findings from the paper.[iv]
Energy-only market prices and RE
The potential impact of increasing amounts of variable renewables (VRE) on an energy-only market such as the NEM are presumed to be around:
- Greater price volatility including events of more extreme prices. This is based on not just output varying with the amount of wind or sun, but also output being poorly aligned with when the power is needed – considered to be especially true of wind farm output in South Australia.
- Reliability price signals – the maximum price cap (MPC) and the cumulative price threshold – needing to increase. This is based on the expectation that with renewables setting the price more often, prices will be low for an increasing amount of time and for all generators to recover their costs, prices would need to be higher when renewables are not in surplus and aren’t setting the price.
The existing MPC is $14,700/MWh, but it is estimated that to achieve the same reliability standard with 100 per cent VRE would require a four-to-five-fold increase in that figure.
To assess the validity of these arguments, the authors considered actual spot prices in South Australia given its high penetration of VRE (around 55 per cent) and found that while spot price volatility had increased, extremely high price events had become less frequent.
Rather than due to greater instances of extremely high prices, higher levels of price volatility had arisen largely due to increased instances of spot prices being in the $100-$300/MWh range a phenomenon that has occurred in all parts of the NEM, not just SA, suggesting renewable penetration is not the only factor at work. However, the authors noted there are increasing instances of extremely low prices in the NEM, especially in the renewables-rich regions of SA and Queensland, as the AEC has previously noted[v].
At the same time, reliability has remained high over the past decade despite the price cap remaining constant in real terms over that time.
Price volatility
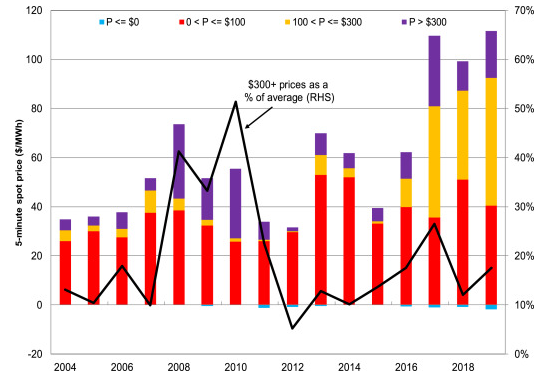
The paper notes that, over 2019, the contribution of extremely high prices was lower than in both 2017 and 2008 (see figure 1 below). In SA during 2019, prices about $300/MWh contributed around 18 per cent to the overall average price of $110/MWh for that year, while in 2008 it contributed to 41 per cent of the average ($74/MWh). Yet renewable penetration in 2008 was 4-8 per cent, compared to 45-50 per cent in 2019. These findings go against the hypothesised impact of higher variable renewables penetration on spot price extremes.
Figure 1: Spot Price Volatility in SA

Rather than peak prices driving up average prices, average spot prices have increased as a result of an increased number of occasions when prices were in the $100/MWh-$300/MWh range – this contributed nearly half to the overall average price, compared to 7 per cent in 2008.
While increased VRE are likely to be a contributing factor, other drivers were considered to be:
- Higher coal and gas prices, particularly between 2016 and 2018.
- The exit of large-scale thermal plants - overall average prices increased sharply between 2012 and 2019 which saw the closure of coal-fired plants in SA (Northern and Playford) and Victoria (Hazelwood).
- The lack of new dispatchable plant coming into the market.
Coal and gas prices have moderated significantly since February 2020, due to the impacts of COVID-19, and the international oil price war. This in turn has led to significantly lower instances of $100-300/MWh spot prices. If coal and gas prices regain their pre COVID levels the authors expect $100-$300/MWh price range to maintain its share of overall prices.
In terms of extremely low spot prices, the paper found that negative prices in 2019 contributed around 1 per cent to the overall average price, a result similar to that noted in 2008, despite a six-fold increase in the amount of renewables in the system.
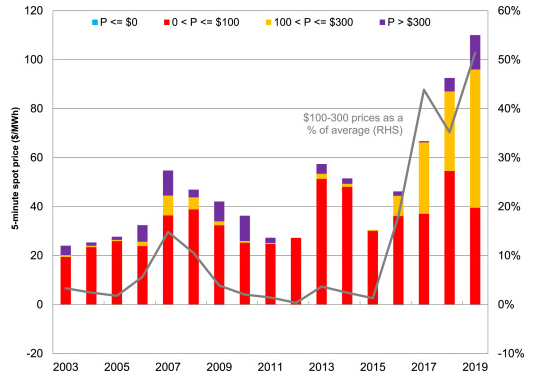
Similar trends were noted for other mainland NEM regions (see figure 2) although overall SA had a larger share of $100-300/MWh prices (48 versus 38 per cent) and negative prices. In SA, low prices have become much more prevalent, rising from 405 periods in 2009 to 1541 a decade later. In summary, there has been increased spot price volatility over time, albeit most of this has been in a relatively narrow, ‘mid-tier’ price band ($100 to $300/MWh), well below the historic and current market price cap. Such volatility has occurred across the NEM, including in regions with both low and high renewables penetration rates, suggesting VRE penetration is not the sole or even the major contributor to this higher price volatility.
Figure 2: Spot price volatility in other mainland NEM regions

Seasonal factors
All the above said, recent Queensland and broader NEM experience suggests greater renewable-induced instances of more extreme prices might be emerging, more as a seasonal phenomenon rather than across the full year (and so averaging prices over a year may obscure the impacts of renewables on spot prices). This seasonality also appears to be greater for solar PV than for wind generation, “reflecting solar PV’s relatively high correlation and co-incident output”, according to the paper.
Peakiness
Less instances of prices of $300/MWh or more would normally be expected to occur if demand were to become less “peaky”, but the authors note that in SA demand has actually become more peaky.
Between 2010-2019, the contribution of prices above $300/MWh to the average SA price fell sharply (see figure 1 above), while the peakiness of demand in the state rose by one-fifth. The paper finds a similar trend for other NEM regions, and notes that this cannot explain the drop in prices over $300 to average spot prices in the NEM.
Reliability outcomes
The paper notes that the MPC would be expected to increase as more VRE come into the grid, but while the MPC has been indexed to inflation, it has lagged the rate of increase in renewables yet this has also occurred without worsening reliability outcomes in the NEM.
Mitigating factors
According to the authors, there are four reasons why increased levels of VRE need not lead to more extreme prices and higher market price caps. These are:
- Increased investment in technologies like storage and interconnectors.
- Increased contract cover.
- More price responsive demand.
- The emergence of extra ancillary service opportunities and revenue streams.
We could, however, see increased extreme spot prices in future under high and rising levels of renewables, particularly if the correlation between renewables across the NEM increases because of lack of geographic and technological diversification, as well as similar weather patterns across regions. This would lead to the potential benefits of increased interconnection being reduced as demand and supply becomes more aligned across regions.
The strength of these four mitigating factors is likely to influence whether the season-specific aspect of recent spot price extremes (in particular, the increased instances of negative prices) remains largely a temporary (seasonal) phenomenon, or instead becomes a sustained, persistent trend.
What do the findings mean for wholesale market design?
While seemingly focused on analysing price outcomes, the paper ultimately plays into the debate about the viability and durability of energy-only markets, as compared to centralised and centrally-procured capacity markets, with a rising penetration of variable renewables. The authors argue the factors that might mitigate spot price volatility and extremes are also likely to influence the NEM’s ability to retain its existing, largely decentralised, energy-only wholesale market design, as more renewables come into the system.
[i] https://aemo.com.au/-/media/files/major-publications/isp/2020/final-2020-integrated-system-plan.pdf?la=en
[ii] See https://www.energycouncil.com.au/analysis/are-renewables-generating-a-new-market-dynamic/; and https://www.energycouncil.com.au/analysis/negative-price-records-set/
[iii] Dr Alan Rai is a director at consultants Baringa Partners, Oliver Nunn, is senior economist at the Australian Energy Market Commission
[iv] On the impact of increasing penetration of variable renewables on electricity spot price extremes in Australia, Economic Analysis and Policy 67, September 2020.
[v] See https://www.energycouncil.com.au/analysis/are-renewables-generating-a-new-market-dynamic/; and https://www.energycouncil.com.au/analysis/negative-price-records-set/
Related Analysis
Certificate schemes – good for governments, but what about customers?
Retailer certificate schemes have been growing in popularity in recent years as a policy mechanism to help deliver the energy transition. The report puts forward some recommendations on how to improve the efficiency of these schemes. It also includes a deeper dive into the Victorian Energy Upgrades program and South Australian Retailer Energy Productivity Scheme.
Beyond the Rebate: Battery Policy, VPPs, and Household Returns
A re-elected Labor Government’s promise to cut home battery costs by 30 per cent through the Small-scale Renewable Energy Scheme (SRES) has sparked interest—and raised questions. While the move may accelerate battery uptake among solar households, critics warn it could deepen inequities by leaving renters and vulnerable customers behind. More importantly greater value will be realised if the storage capacity is also coordinated through mechanisms like Virtual Power Plants (VPPs). We take a look at the benefits of VPPs.
Australia's Solar Waste: A Growing Problem
Australia has long been a global leader in the adoption of solar energy, with one of the highest per capita rates of rooftop solar installations worldwide. Solar power has become a cornerstone in the nation's commitment to sustainability, contributing significantly to reducing its carbon footprint and reliance on fossil fuels. However, as solar panels reach the end of their lifespan, the issue of solar panel waste is rapidly emerging as a significant environmental challenge that could escalate in the coming decades. We take a closer look.
Send an email with your question or comment, and include your name and a short message and we'll get back to you shortly.


