

by Graham Pearson
Predicting the future: How four scenarios will shape the WEM
Power systems are often unplanned and organic, changing over time to reflect new technologies, population movements, and economic growth.
The South West Interconnected System[i] (SWIS) in Western Australia is no different. The Australian Energy Market Operator (AEMO) forecasts the generation requirements, Western Power is responsible for planning the development of its network, but there is no single entity responsible for planning the power system and coordinating activity with an eye to the future.
This changed in March 2019 when the Minister for Energy announced that an inaugural Whole of System Plan (WOSP) would be developed to help shape WA’s energy future. Unlike its East-Coast equivalent, the Integrated System Plan (ISP), the WOSP is not led by AEMO but by the State Government, supported by both AEMO and Western Power. The team behind the WOSP have now shared some preliminary results with industry stakeholders ahead of government approval to publish the final WOSP in the coming months. In this article, we take a look at the scenarios used in the modelling and what the results might mean for WA’s future power system.
The four scenarios
The WOSP is one of the workstreams falling under the State Government’s Energy Transformation Strategy. According to the Energy Transformation Implementation Unit (ETIU), who are responsible for delivering the WOSP, its purpose is to “demonstrate how to deliver electricity supplies at lowest sustainable cost within the reliability and security standards over a 20 year period.”[ii]
Focusing exclusively on the SWIS, which supplies electricity to more than 1.3 million homes and businesses, the WOSP will assist in guiding the generation and network investments that may be required to meet future demand. It will inform regulatory decisions, and policy and market development initiatives, and identify how security and reliability can be maintained during the transition from traditional energy sources to new, smaller-scale, distributed technologies including battery storage.
The starting point for the WOSP was determining the scenarios that would underpin the modelling. Western Power developed over 50 potential scenarios relating to different combinations of economic, demographic and technological change.[iii] From there, ETIU worked with Western Power and AEMO to identify four diverse scenarios that represent potential future demand and technological developments that will impact the supply and demand for grid-connected electricity in the next 20 years. The four scenarios are titled: Cast Away, Groundhog Day, Techtopia and Double Bubble.
When choosing the scenarios, ETIU focused on the following factors:
- How much energy is being used in the SWIS? Is it coming from population growth or economic growth (or both), and is it mining or non-mining growth?
- Where is the energy being used?
- What is the source of energy? Is it self-generation or centralised?
ETIU then nominated four scenarios to represent different rates of transition around two critical issues:
1. Decarbonisation the move from traditional forms of thermal generation; and
2. De-centralisation – a trend where more consumers disconnect from the main network grid, with the emergence of microgrids and standalone power systems.[iv]
Importantly, the WOSP is modelling a range of scenarios to determine the “least regret” investment options; it will not determine a precise “expected” future. There are also no preferred scenarios.
The key aspects of the four scenarios are shown below.
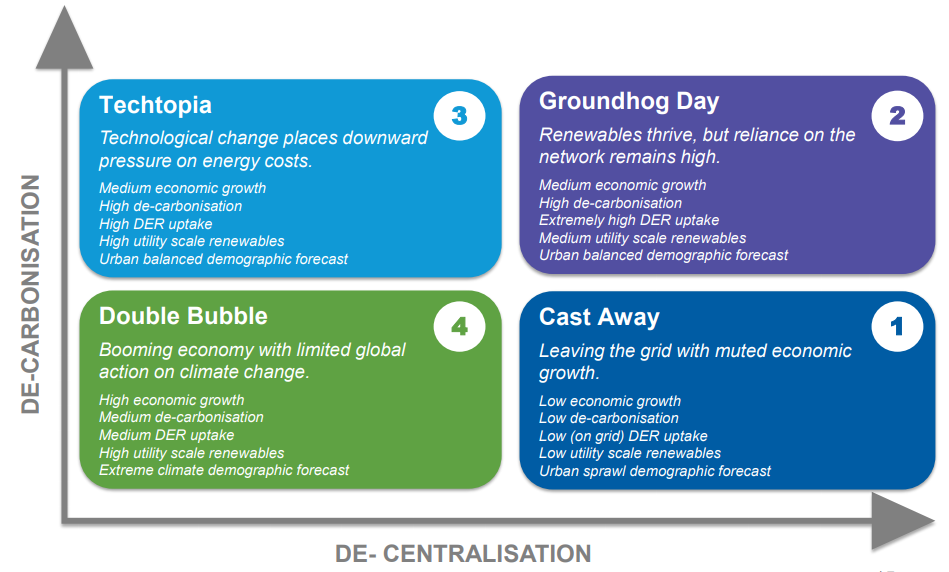 Source: Energy Transformation Taskforce Information Paper[v]
Cast Away is a scenario with ed as having muted economic and population growth, with disconnection from the grid in favour of self-supply. The WOSP began modelling work long before the impacts of COVID-19 became apparent but this scenario most represents the difficult economic conditions expected over the coming years.
Groundhog Day is an extension of the current characteristics of the market. Distributed Energy Resources (DER) thrive with a growth in rooftop PV resulting in an extreme “duck curve”, but modest economic growth means demand remains steady.
Techtopia is based on stronger economic growth creating higher operational demand. There is lower uptake of rooftop PV, but growth in electric vehicles and home automation.
Finally, Double Bubble represents a booming economy with significant population growth doubling demand by 2027/28. While DER uptake is moderate, but huge amounts of utility scale renewables come onto the grid.
Demand forecast
Each of the scenarios incorporated different assumptions and inputs that would ultimately translate into unique demand levels.
Shown figure 1 below is the assumed annual operational demand (in GWh) for each of the scenarios. Not surprisingly, Cast Away and Groundhog Day had flat, and potentially declining, demand over the 20-year period largely due to the high uptake in DER (Groundhog Day) and the shift to self-supply (Cast Away).
In contrast, Techtopia and Double Bubble saw big jumps in operational demand, driven by their economic and population growth assumptions.
Figure 1: Four demand scenarios – Annual operational demand (GWh)
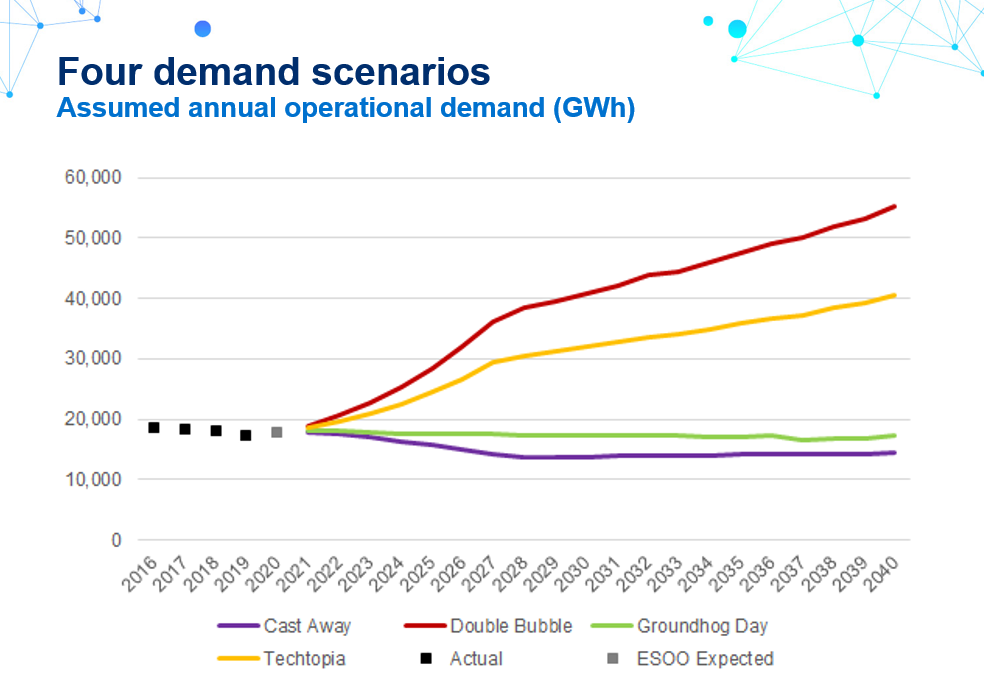 Source: Energy Transformation Implementation Unit
The large gap between the Groundhog Day and Techtopia demand levels – a steady and flat demand compared to one that jumps sharply and continues to increase – leaves a “middle” area that perhaps could have been better covered: a scenario other than business-as-usual but less aggressive than Techtopia, where there is medium economic growth, less reliance on the grid, PV continues to flourish and conditions encourage moderate investment in utility scale solar.
But that shouldn’t detract from the existing WOSP modelling which has produced some interesting insights and emerging themes. So, what were they?
The generation mix
All of the scenarios resulted in a different generation mix in 2040 compared to today, although the inputs meant that there were variations in each model.
ETIU analysed the viability of new generation assets and also assessed when existing assets may leave the grid. This involved looking at the revenue, costs (fuel and O&M) and capex for each of the new assets to determine their IRR and NPV, and considering the returns and operating life for existing assets based on market factors and ramp up/ramp down impacts on coal power stations. On top of this, assumptions on rooftop PV were incorporated into each scenario.
With all of this included in the modelling, the generation capacity in each scenario changed at approximately the same rate as the projected operational demand (see figure 1 above). Cast Away had growth in rooftop PV, little new utility scale renewables and some coal exited the grid in the mid-2020’s. Groundhog Day saw a massive jump in rooftop PV and a gradual decline in coal, while Techtopia and Double Bubble both had muted rooftop PV growth but big jumps in utility scale solar and wind generation.
Interestingly, each of the scenarios showed that battery storage would play a role over the next 10 years. Cast Away and Groundhog Day projected between 70-90MW of 2-hour storage over 2021-23; Techtopia has approximately 50MW of 2-hour storage in 2021 followed by approximately 20MW of 4-hour storage in 2023-24; and Double Bubble forecasts huge amounts of 4-hour storage every year between 2021 and 2025, with the highlight being approximately 175MW in 2023.
In total, the modelling paints an interesting picture for the SWIS generation mix over the coming decades. Again, there might have been a missed middle-ground between the muted rooftop PV trajectory of Techtopia and the high-growth rooftop PV scenario under Groundhog Day but there were a couple of common themes: gas generation stayed relatively stable, there’s going to be a role for battery storage, and coal generation will decline.
Wind generation and network augmentation
The WOSP also modelled the optimum location and timing for wind generation over the coming years.
It is often instinctively thought that the area north of Perth best suits new wind generation projects. However, after analysing the revenue, operating and capex costs, and taking into account existing transmission infrastructure and grid connection costs, the WOSP modelling highlighted short-term investment opportunities in the south-west and south-east. All of the scenarios point to new wind generation in the south-east, Techtopia and Double Bubble also shows massive amounts of wind generation in the south-west, while each scenario has new wind generation expected in the eastern Goldfields.
Perhaps more significantly, with the forecast generation mix and new wind projects focusing on the south-west and south-east, the modelling expects that no transmission network augmentation is required for Cast Away and Groundhog Day over the next 10 years, and Techtopia will only require an upgrade to one line in the mid-east.
The next step
The WOSP is a substantial piece of work that’s a first of its kind in Western Australia. The State Government should be applauded for commissioning the project and ETIU credited for completing a detailed model that will guide future generation and network investments, and inform decision making.
All of the scenarios represent a different future power system in Western Australia; some have higher demand than others, and they all have different generation mixes. What’s common throughout is that battery storage will come onto the grid over the next decade, coal output will decline, gas generation remain relatively stable and there will still be some role for rooftop PV. In this there is considerable alignment with the East Coast’s ISP.
But despite all the challenges of putting together such a complex model, the next step may be the hardest for ETIU. The work undertaken to-date is more a modelling exercise – underscored by ETIU not preferring any particular scenario – than a plan for how the State Government can shape the power system over the next two decades. An important remaining question is how will the ETIU and the State Government take this information to plan a power system that facilitates the market for the years ahead?
[i] The SWIS is the electricity grid covering the most populous areas of WA. It covers the southwest region and extends to Kalbarri in the north and Kalgoorlie to the east
[ii] See p7, https://www.wa.gov.au/sites/default/files/2019-08/Whole-of-System-Plan-Industry-Forum-Presentation-12-July-2019.pdf
[iii] See p4, https://www.wa.gov.au/sites/default/files/2019-08/Information-paper-Whole-of-System-Plan-Modelling-Scenarios.pdf
[iv] See p4, https://www.wa.gov.au/sites/default/files/2019-08/Information-paper-Whole-of-System-Plan-Modelling-Scenarios.pdf
[v] See p4, https://www.wa.gov.au/sites/default/files/2019-08/Information-paper-Whole-of-System-Plan-Modelling-Scenarios.pdf
Send an email with your question or comment, and include your name and a short message and we'll get back to you shortly.