

by Carl Kitchen
New electricity report highlights production changes, trading and prices
Updated data from the International Energy Agency (IEA) has highlighted the shifting mix in generation across both OECD and non-OECD countries, as well as the increased flow of electricity across national borders as the energy mix has changed and changes in OECD electricity prices since 1978.
The IEA Electricity Report 2019 shows that 2018 saw the share of output from gas generation in the OECD-member countries reach 27.9 per cent of the total output, topping coal-fired generation at 25.6 per cent for the first time.
At 27 per cent, the combined share of generation output from renewables and waste was also higher than coal, while nuclear supplied under one fifth of total generation (17.7 per cent). The major decline in nuclear output follows the Fukushima disaster in Japan and subsequent decisions by major nuclear nations like Germany and Japan to either move away fully from this source of power generation or to reduce its contribution in their energy mix (see figures 1 and 2).
Figure 1: Share of OECD gross electricity production by source 1974-2018p[i]
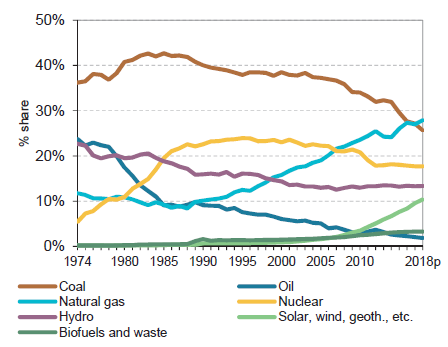
Source: IEA
Figure 2: OECD gross electricity production by source, 2018p
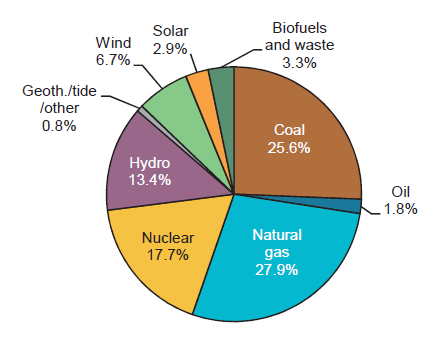
Source: IEA
While coal’s share of generation in non-OECD countries grew from the early 1980s, it peaked in 2013 at 48.6 per cent and since then has fallen slightly. The report shows that coal’s share of the generation mix was 46.8 per cent of non-OECD generation in 2017. More details on energy production and demand are included later in this article.
Trade
Increasing energy flows between regions, particularly between neighbouring countries as the overall generation mix continues to change, is also highlighted in this latest report. The IEA found that electricity trade between neighbouring countries, particularly in the OECD’s European member countries has become much more common (see figures 3 and 4 below).
Overall in the OECD, the import of electricity grew from 89 TWh in 1974 to 490 TWh in 2018, representing average annual growth of 4 per cent, an overall growth rate in electricity supply of 2.1 per cent. In 1974 imports represented 2 per cent of OECD electricity supply, and by 2018 this share had risen to 4.4 per cent.
OECD exports of electricity grew from 81 TWh in 1974 to 480 TWh in 2018. The average annual growth rate was 4.1 per cent. In 1974 exports represented 1.8 per cent of the OECD’s electricity supply and by 2018 this had increased to 4.3 per cent.
In OECD Americas, total imports increased by an average annual rate of 3.3 per cent between 1974 and 2018.
Figure 3: OECD Europe net importers and exporters of electricity (GWh), 2018p
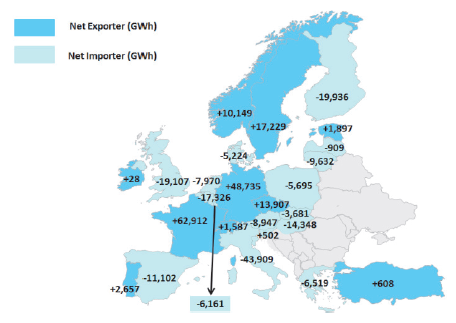
Source: IEA
Figure 4: OECD Europe electricity imports and exports
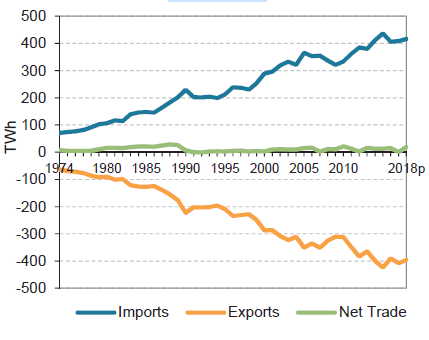
Source: IEA
Power Prices
In 2018 average real electricity price across OECD-member countries decreased by 0.6 per cent compared with 2017. This was driven mainly by lower prices for industry (-1.1 per cent), while prices for households in the same period were effectively flat (-0.1 per cent).
Electricity prices for consumers vary widely by type across OECD countries. Based on available data, in 2018 the OECD weighted average electricity price for industry was USD 106.50 per MWh. Prices varied from a low of USD 68.11/MWh in Norway (which is 36 per cent lower than the OECD average), to a high of USD 174.39/MWh in Italy (63.7 per cent higher).
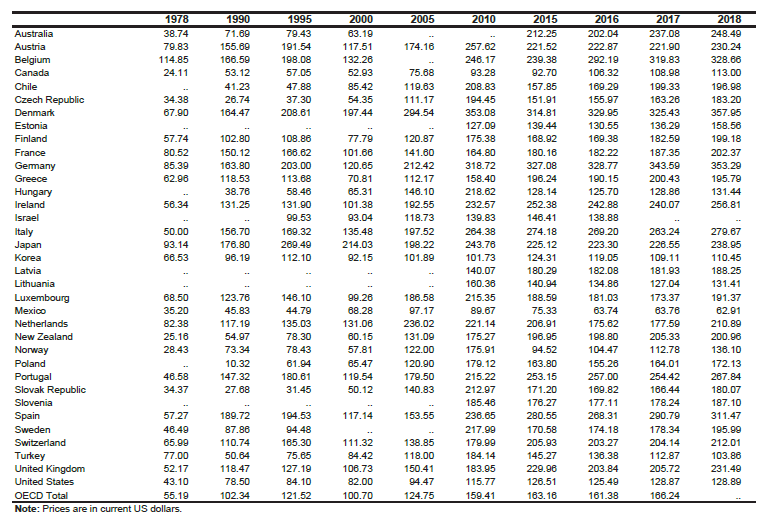
In 2018 the OECD weighted average electricity price for households was USD172.33/MWh. Prices varied from a low of USD 62.91/MWh in Mexico (63.5 per cent lower than the OECD average) to a high of USD 357.95/MWh in Denmark (107.7 per cent higher). Australia’s household prices were USD248.49/MWh. Table 1 shows the household prices across all OECD-member countries.
Table 1: Electricity prices for households in US dollars/MWh
Energy Production
Between 1974 and 2017, world gross electricity production (including pumped hydro) increased from 6 298 TWh to 25 721 TWh, an average annual growth rate of 3.3 per cent. In 2017, production was 2.5 per cent higher than 2016. Year-on-year, global electricity production has grown each year since 1974 (the exception is between 2008 and 2009 when the global financial crisis impacted economic activity).
In 2017, non-OECD countries’ share of production reached 57 per cent of world electricity generation, more than double the share those countries represented in 1974 (28 per cent). This reflects the higher average growth rate in the non-OECD countries, which includes the major growth economies of China and India, since then.
From 1974 to 2000, electricity production increased at an average annual rate of 4.6 per cent in non-OECD countries, compared with 3 per cent in OECD countries. The difference in the respective growth rates of member and non-member countries widened further following the turn of the century, with annual production growth between 2000 and 2010 averaging just 1.1 per cent in OECD countries, compared with 6.4 per cent in non-OECD countries. The growth rates in both groups of economies fell after 2010, but the divergence in electricity production continued. As a result, in 2011, non-OECD electricity production was higher than OECD production for the first time as shown in figure 5 below.
Figure 5: Total gross electricity production
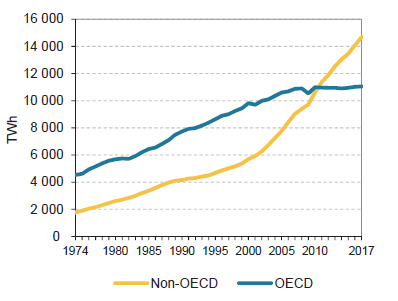
Source: IEA
Between 2017 and 2018, there was a slight fall (-0.5 per cent) in electricity production from fossil fuels, the sixth consecutive annual drop, with lower output from coal (-4.6 per cent) and oil (-9.0 per cent) offsetting increased production from natural gas (+4.4 per cent). Variations in weather conditions and the recommencement of electricity production at some nuclear reactors in Japan contributed to modest increases in output from nuclear (+1.1 per cent) and hydro plants (+1.6 per cent), while wind (+7.0 per cent) and solar (+19.8 per cent) showed what is described as robust growth.
Energy demand increased 2.6 per cent between 2016 and 2017, with final world consumption reaching 21,372 TWh. The average growth rate between 1974 and 2017 was 3.3 per cent.
In OECD-member countries electricity demand at 9,518TWh was only 0.2 per cent higher than the previous year. Provisional data for 2018 shows a 1.1 per cent increase from 2017 (11,173TWh). Most of the growth in the OECD since 1974 has come from commercial and public services and residential demand. The combined share of electricity in these sectors has grown from 48.4 per cent in 1974 to 62.5 per cent in 2017 (see figure 6).
Figure 6: OECD electricity final consumption by sector, 2017
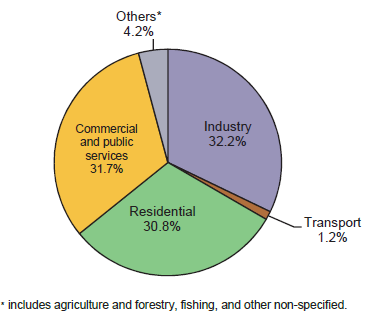
*Others includes agriculture and forestry, fishing and other non-specified. Source: IEA
In non-OECD countries demand was 11,854TWh in 2017, up 4.6 per cent over 2016. Most demand came from industry, followed by households (see figure 7).
Between 1974 and 2017 electricity final consumption increased at an average of 5.1 per cent. The share of world electricity final consumption in non-OECD countries has shown sustained growth in that period increasing from 27 per cent in 1974 to 55.5 per cent in 2017. The four largest consumers in this grouping were China, India, the Russian Federation and Brazil and these countries represent 67.2 per cent of all non-OECD electricity demand.
Figure 7: Non-OECD electricity final consumption by sector, 2017
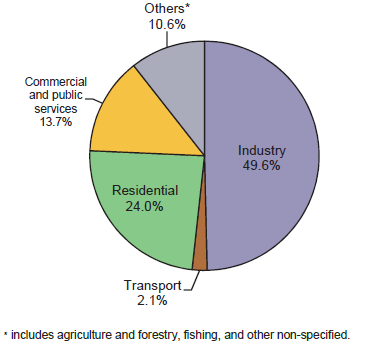
* Others includes agriculture and forestry, fishing and other non-specified. Source: IEA
[i] Provisional data for 2018 from OECD members and other countries for which official data are available.
Send an email with your question or comment, and include your name and a short message and we'll get back to you shortly.