

by Duncan MacKinnon
Moving the goal posts: What changed in the ESOO?
Two weeks ago the Australian Energy Market Operator (AEMO) produced its 2018 Electricity Statement of Opportunities (ESOO). The Energy Networks Association ran an EnergyInsider article on this which summarised[i] its major points. However one matter that surprised many Australian Energy Council members is how the Victorian 2018-19 outlook deteriorated so substantially from previous outlooks, without any obvious change in conditions. It appears to mostly relate to a change in methodology, with the result being that AEMO has armed itself with the right to intervene in the market for the second summer in a row. We attempt to unpack the story below.
How the outlooks changed
Using the average of repeated simulations, the ESOO forecasts the reliability of each National Electricity Market region against the reliability standard, which requires that, over a year, an expectation of no more than 0.002 per cent of demanded energy is unserved (USE). This equates to roughly 10.5 minutes of load shedding per customer per year caused due to generation shortfall (distribution reliability typically targets over 100 minutes).
The ESOO published in October 2017 forecast that Victoria and South Australia would approach the 0.002 per cent shortfall for the summer 2017-18 (the yellow dots below) but would remain well below for the subsequent years[ii].
Figure 1: Range of USE Outcomes Linked With Key Drivers
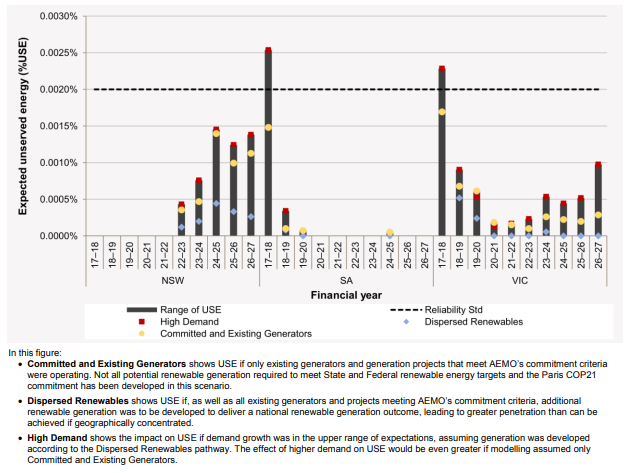
Source: 2017 ESOO
When AEMO forms the view (unverified by any other party) that reliability may breach the standard it then has the right to intervene in the market, for example by invoking the Reliability and Emergency Reserve Trader (RERT), which it did for the 2017-18 summer in Victoria and South Australia. The rules do not constrain the amount of intervention used to meet the reliability standard, and AEMO purchased a remarkable quantity of RERT for that summer, 1141MW, costing consumers some $51 million, none of which, in hindsight, averted any actual load interruption. This outcome was summarised in previous EnergyInsider pieces.[iii]
However as can be seen from the yellow dots in 2018-19 and beyond, it seemed that the RERT would be a one-off unless conditions deteriorated, say with a major failure in a large plant. The good outlook largely remained in place, updated through AEMO’s “Medium Term Projected Assessment of System Adequacy” (MTPASA) which performs effectively the same calculation every week for the coming two years using the latest generator and demand information.
Figure 2: Estimated Unserved Energy by Region (2018-07-16 09:00:00 #48)
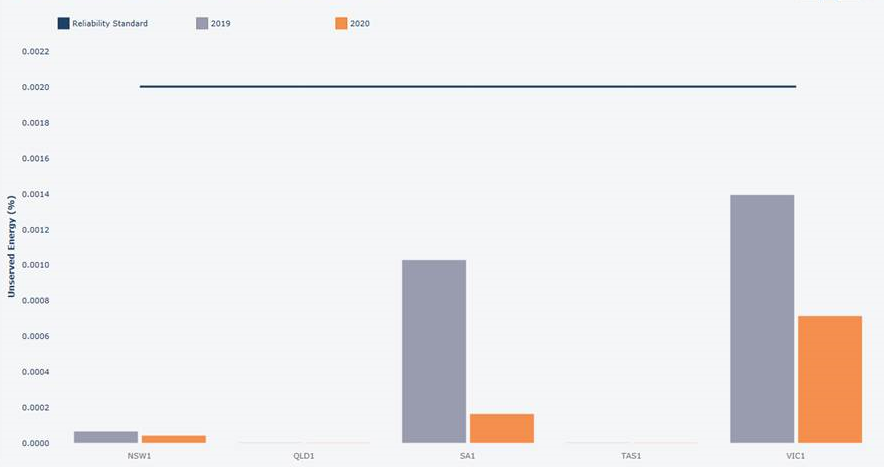
Source: MTPASA output 16 July 2018
On 17 July 2018 AEMO confirmed this optimistic view by publishing an official notice of “…no Low Reserve Conditions for the next two years”.
However on 24 August the 2018 ESOO was published[iv] with a surprising deterioration for 2018-19 from the MTPASA position published only the week prior, showing Victoria now sitting very close to the standard. The long-term outlook also dramatically deteriorated from the ESOO 2017.
Figure 3: Forecast USE outcomes – Neutral demand, only existing and committed projects
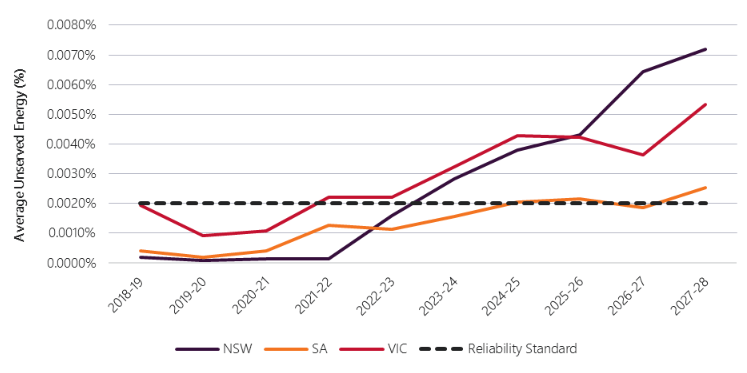
Source: 2018 ESOO.
The next and subsequent MTPASA updates also reflected this deterioration, with Victoria now sitting a margin outside the reliability standard for the first year.
Figure 4: Estimated Unserved Energy By Region (2018-08-27 09:55:37 #66)
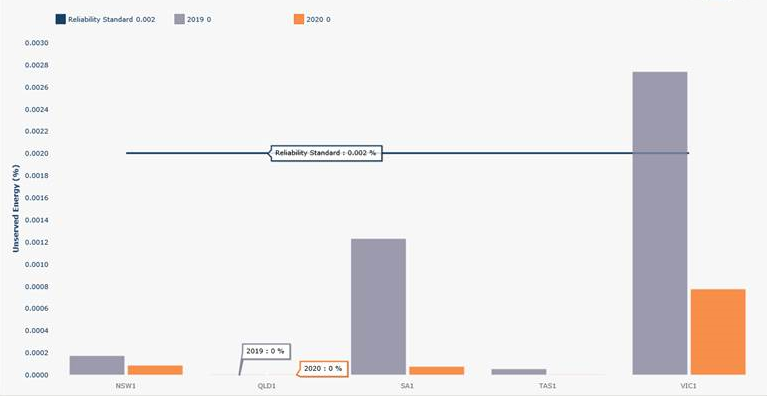
Source: MTPASA 27 August update
In response to this deterioration, AEMO has restarted the RERT acquisition process and is again targeting an amount of capacity intended to bring the forecasts to well within the standard. (Note that there is no obligation for AEMO to acquire sufficient reserves to “just meet” the standard; instead AEMO has latitude to purchase as much as it deems fit.) Indeed AEMO invited RERT tenders on 23 July 2018, over a month prior to this ESOO, which suggests AEMO had some expectation of the deterioration – despite several within-standard MTPASA iterations being published between these dates.
So what changed?
As all the information needed is not made public, the AEC has to perform a degree of supposition in its analysis. It would appear that there were no step changes in supply availability.
The maximum demand forecasts for 2018-19 have slightly increased which would have worsened the outlook. The Victorian 10 per cent Probability of Exceedance (PoE) summer demand was increased by about 150MW and the South Australian by 50MW. However it appears this increase was adopted into the MTPASA several months before the ESOO release, without tipping it over 0.002 per cent.
From an external vantage point, the biggest change appears to be in the generator forced outage rates (FOR) which AEMO applied to their modelling for both the ESOO and MTPASA, for which the Victorian and NSW figures substantially increased from previous years’ studies.
Table 1: Forced Outage Assumptions
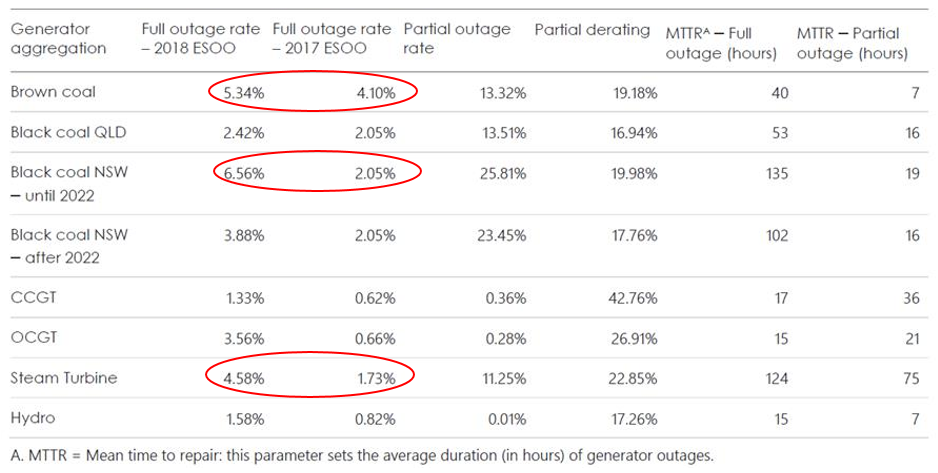
Source: 2018 ESOO
To understand why these arcane quantities are so important, we need to explain a bit about how reliability forecasting works. The ESOO and MTPASA both use a Monte Carlo power system simulation where forecasts of demand patterns and generation are simulated many times over. Demand and intermittent generation traces are combined with scheduled generation, the latter of which is subject to a probability of failure. For every simulation hour dice are rolled for each scheduled unit, and the unit is modelled to fail according to the probability implied by the FOR. Hence, if a unit has a 0 per cent FOR, it will be assumed to be available to generate continuously. If it has a 5 per cent FOR, then for 5 per cent of simulations it will be on outage at the time of critical system stress, and in some simulations there may be several units on outage and load will unavoidably have to be shed.
The relationship is complex, but USE moves exponentially in response to a change in FOR.
Most relevant to a region’s unserved energy will be the generation within that region. Hence the brown coal FOR increase and (gas-fired) steam turbine (Torrens Island and Newport) change are probably key to the Victorian and South Australian USE increases. However the sharing of reserves between the states mean that the NSW deterioration would also have had some effect.
Why did the forced outage rates deteriorate so much?
AEMO annually surveys generators for a full confidential history of their outage data. This is used to make up a typical historical performance of particular units, and is the same information that plant owners themselves rely upon to predict their own risks.
Previous ESOOs have relied on the full historical record which goes back to the start of the NEM. The data is notoriously noisy because units have exceptionally good and bad years, but longevity in the collection smooths this noise out over time.
However in the 2018 ESOO, AEMO states “For a number of technology aggregations, there has been a clear deterioration in reliability… AEMO has used only the most recent three years of outage data for brown coal, black coal and gas-fired steam turbines”.[v] Thus for the bulk of the dispatchable fleet AEMO has discarded the previous 17 years of data and relied only upon a very limited sub-set.[vi] Without any evidence it is at liberty to share, it claims that these generators’ performance is declining, presumably due to age.
Generator FORs exhibit a “bathtub curve” where FORs are highest at the very start and very end of life, while middle aged generators are the most reliable. The majority of the coal and gas fleet is in middle age, with only one coal and one gas power station with an approaching retirement date that would lead one to expect a material increase in FOR.
More likely, by using data from a short period, it has been affected by random anomalies. For example, it is well known that the middle-aged Loy Yang A plant had a number of major outages during this period that were unrelated to general condition or age.
Conclusion
While ideally reliability forecasting activities should be transparent, in practice its complexity and confidentiality means that we will always have to rely on the expert judgement of the market operator to perform the difficult calculations which, at their core, attempt to balance reliability against cost.
But at the same time the market operator cannot be entirely independent, as it is exposed to an asymmetric risk – it will suffer acute criticism should there be an interruption, whereas additional costs tend to be smeared over time and forgotten. In addition, AEMO is currently seeking to progress a number of controversial proposals in the reliability area, whose prospects are improved if stakeholders have a heightened perception of reliability risk.
As can be seen by the surprise adjustment in the collection of FORs, there are many obscure ways in which the calculations can be skewed one way or the other, and with the limited publicly available data, it is impossible to challenge its reasonability. However the changes made undermine confidence in AEMO’s impartiality, and invite questions about the governance of the forecasting process. The Energy Security Board identified this issue and addressed it by proposing that the Reliability Guarantee forecasts be subject to detailed review by the Australian Energy Regulator. Another approach used in many markets is to split system and market operations. An independent market operator’s distance from the stresses of system operation provides additional confidence to stakeholders that forecasts have been correctly compiled, and judgement appropriately exercised.
[i] https://www.energynetworks.com.au/news/energy-insider/aemo-really-reporting-1-3-blackouts-summer-0
[ii] https://www.aemo.com.au/Electricity/National-Electricity-Market-NEM/Planning-and-forecasting/NEM-Electricity-Statement-of-Opportunities
[iii] https://www.energycouncil.com.au/analysis/planning-for-summer-what-have-we-learnt/
[iv] https://www.aemo.com.au/-/media/Files/Electricity/NEM/Planning_and_Forecasting/NEM_ESOO/2018/2018-Electricity-Statement-of-Opportunities.pdf
[v] 2018 ESOO Appendix A1.3
[vi] Note the dataset has (correctly) also removed data from recently closed plants.
Related Analysis
Retail protection reviews – A view from the frontline
The Australian Energy Regulator (AER) and the Essential Services Commission (ESC) have released separate papers to review and consult on changes to their respective regulation around payment difficulty. Many elements of the proposed changes focus on the interactions between an energy retailer’s call-centre and their hardship customers, we visited one of these call centres to understand how these frameworks are implemented in practice. Drawing on this experience, we take a look at the reviews that are underway.
Data Centres and Energy Demand – What’s Needed?
The growth in data centres brings with it increased energy demands and as a result the use of power has become the number one issue for their operators globally. Australia is seen as a country that will continue to see growth in data centres and Morgan Stanley Research has taken a detailed look at both the anticipated growth in data centres in Australia and what it might mean for our grid. We take a closer look.
Green certification key to Government’s climate ambitions
The energy transition is creating surging corporate demand, both domestically and internationally, for renewable electricity. But with growing scrutiny towards greenwashing, it is critical all green electricity claims are verifiable and credible. The Federal Government has designed a policy to perform this function but in recent months the timing of its implementation has come under some doubt. We take a closer look.
Send an email with your question or comment, and include your name and a short message and we'll get back to you shortly.