

by Emma Richardson
Lower lows for electricity demand in Victoria
Demand for electricity in Victoria has been falling consistently since 2010 in line with falls seen in the National Electricity Market (NEM) overall. And while Victoria’s population and economic growth steam ahead the state is not seeing the same recovery in electricity demand. So why isn’t the state’s energy demand recovering?
Economic headwinds in South Australia and Tasmania (coupled with serious security issues in 2016 that dented annual demand) help explain the continued decline in demand in those states. In Victoria, rising energy efficiency, consumer response to rising electricity costs and structural adjustments in industry with the downturn in mining and manufacturing, have all contributed to the fall in demand.
Contraction in average power demand
Figure 1 below shows the contraction in Victoria’s average electricity demand. In 2016, demand fell 2 per cent to 5,130 MW compared to 5,290 MW in 2015. In comparison, Queensland’s average demand for electricity increased over 4 per cent in 2016, while overall NEM demand was flat. Queensland’s buoyant economy and the ramp up in LNG production increased that state’s electricity demand.
Figure 1: Victoria’s average electricity demand and annual growth (LHS)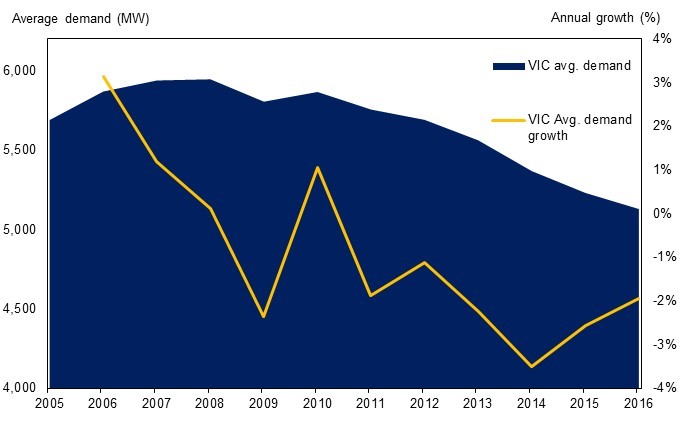 Source: NEM Review, 2017
Figure 2 shows that Victoria’s share of NEM electricity demand is falling. The key factor is the structural adjustment underway in the economy with a shift away from heavy energy users, such as manufacturing and mining, toward services and construction, which are the sectors that have led the State’s economic growth.
Figure 2: Victoria’s electricity demand as a share of NEM demand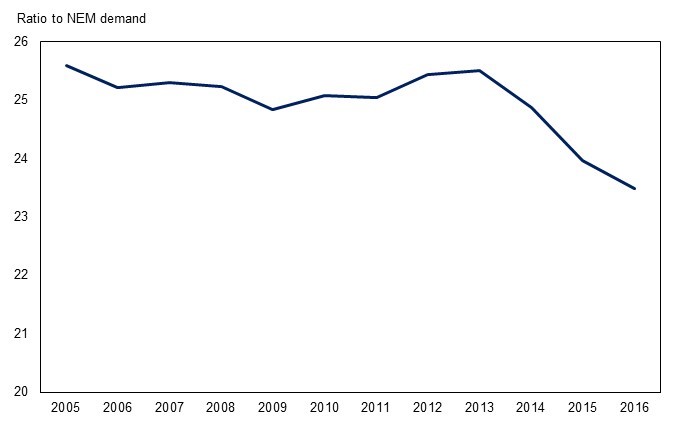
Source: NEM Review, 2017
Population growth (the highest in the nation at 2.1 per cent in 2015-16[i]) is contributing positively to economic growth and energy demand, but this is being offset by reductions in electricity demand from industry. Energy demand is generally underpinned by population and economic growth – as economic activity and output grows, so does the need for power.
Figure 3 shows that in 2015-16, the largest contributors to economic growth in Victoria were the financial services and construction industries each contributing 0.6 percentage points to the State’s growth[ii]. Manufacturing, traditionally a large energy consumer, detracted 0.2 percentage points from state growth highlighting the shift in Victoria’s industry mix toward services sectors which use relatively little energy for production compared to manufacturing, mining and refining.
Figure 3: Victoria’s industries by contribution to state growth 2015-16 (% points)
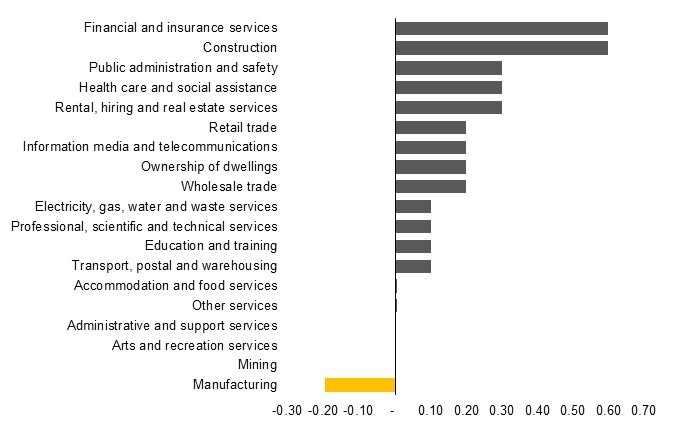
Source: ABS, 2016, National Accounts: State Accounts.
These key industries that would normally have contributed to Victoria’s electricity demand are facing commercial pressures and lowering production, or winding down operations altogether. Manufacturing in Australia and Victoria has been in decline as car manufacturing and processing of petroleum and mineral resources close or reduce production. In Victoria, the decisions to wind down Holden, Ford and Toyota were taken several years ago. While the full effects will take time to filter through the State economy (Ford wound down, then closed operations in Victoria in 2016 while Holden and Toyota plan to close later this year), the closure of these large operations is flowing (and will continue to flow) onto the many parts manufacturers that supplied car makers in Victoria. Figure 4 and 5 below show the reduction in national manufacturing production and employment in Victoria respectively[iii].
Figure 4: Manufacturing industry gross value added production
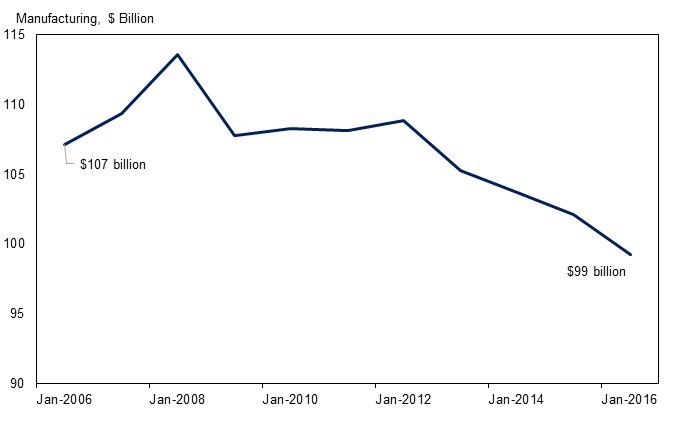
Source: ABS, 2016, National Accounts: State Accounts.
Figure 5: Manufacturing employment in Victoria (number employed ‘000)
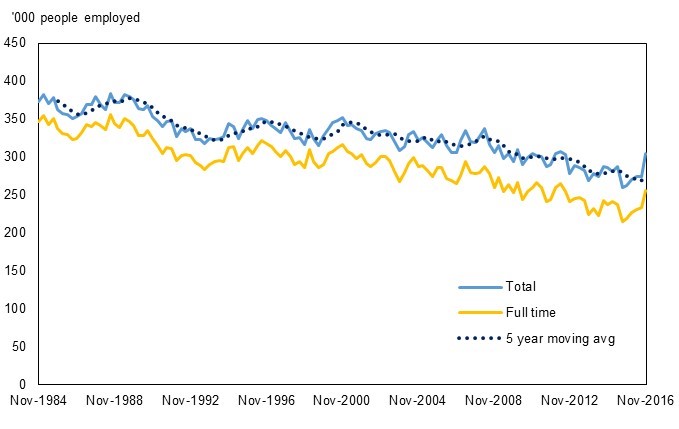
Source: ABS, 2016, Detailed Labour Force Statistics.
Victoria’s electricity demand also fell as a result of the modest world demand growth for aluminium[iv] and the closure of Point Henry aluminium smelter in 2014. While in 2016 the Portland aluminium smelter reduced production following a blackout in December. Alcoa will continue to operate the Portland aluminium smelter in the near term. However, the outlook for aluminium production is for modest growth with export unit value forecast to rise 1 per cent in 2017-18[v].
Table 1 below compares the actual outcome for 2016 electricity demand with the Australian Energy Market Operator’s (AEMO) forecasts published in mid‑2016[vi]
Table 1: Electricity demand (MW), state and NEM, 2016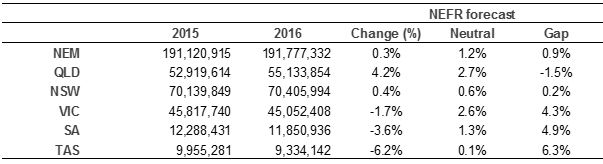
Source: AEMO, NEFR 2016 and NEM Review 2017.
Falling average electricity demand in Victoria has been accompanied by falling minimum demand. This is due to the lower industry energy demand mentioned above, energy efficiency measures and the uptake of solar PV. Large manufacturing and refining operations are unique in their energy use because they require a constant, large supply of power. The reduction in demand from large energy users can be seen in the declining minimum demand over a number of years (Figure 6 below).
Figure 6: Minimum demand in Victoria and linear trend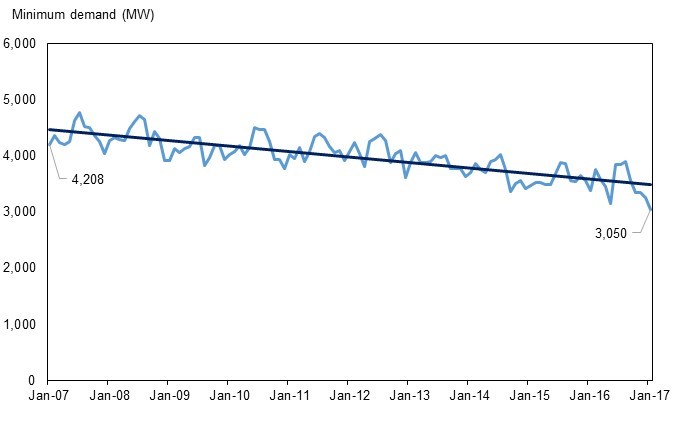
Source: NEM Review, 2017
Lower minimum demand outcomes create challenges for energy security and planning for infrastructure investments. Falling minimum demand, combined with the uptake of distributed generation, such as solar PV and battery storage, mean that in the future at some times of the day, demand needed from the grid could fall to zero. In 2015, AEMO forecast that, by around 2023–24, South Australia’s minimum demand from the grid would fall to zero, meaning rooftop PV alone would supply all customer demand at times[vii]. This may cause network stability and operational issues, such as voltage and frequency control challenges. As demand from the grid fluctuates during the day, the market operator uses firm generators to adjust their output to regulate voltages and frequency in the network and keep the lights on. If all generators are offline due to low demand, the market operator would not have these tools available to them. In the long term, if Victoria’s minimum demand continues to trend down, challenges to secure and reliable power supply will need to be addressed.
For now, the amount of surplus energy in Victoria’s network is high given the declining electricity demand resulting from structural shifts in industry. Figure 7 below shows the rise in average surplus generation in Victoria. When Hazelwood power station closes in March, around 1,542MW of capacity will be removed from the Victorian region, which will tighten supply. Although incentives under the national Renewable Energy Target and Victoria’s planned Renewable Energy Target are likely to drive more generation into the mix, this may result in new plant that is not oriented to contribute firm supply to meet demand peaks or provide security services to the market operator.
Figure 7: Surplus generation in Victoria and closures of large energy users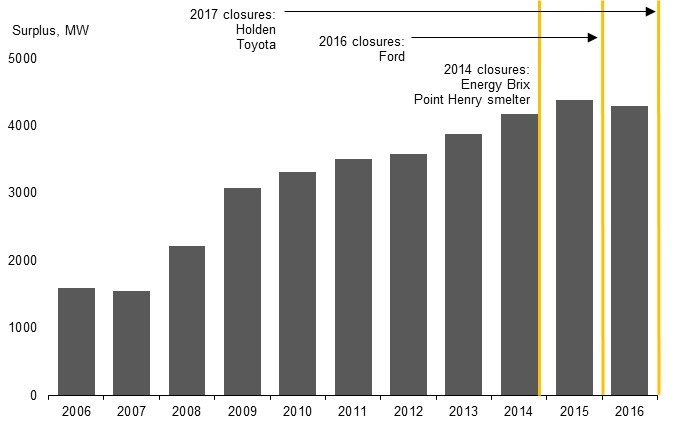
Source: NEM Review, 2017
Note: Surplus generation is measured as total generation made available at a facility minus energy demand.
[i] ABS, 2016, cat no. 3101.0, Australian Demographic Statistics.
[ii] ABS, 2016, cat no. 5220.0, Australian National Accounts: State Accounts.
[iii] ABS, 2016, cat no. 6291.0.55.003, Labour Force, Australia, Detailed, Quarterly.
[iv] Office of the Chief Economist, December 2016, Resources and Energy Quarterly, https://industry.gov.au/Office-of-the-Chief-Economist/Publications/Documents/req/REQ-December-2016.pdf
[v] Office of the Chief Economist, December 2016, Resources and Energy Quarterly, https://industry.gov.au/Office-of-the-Chief-Economist/Publications/Documents/req/REQ-December-2016.pdf
[vi] AEMO, 2016, National Electricity Forecasting Report, http://www.aemo.com.au/Electricity/National-Electricity-Market-NEM/Planning-and-forecasting/National-Electricity-Forecasting-Report
[vii] AEMO, 2016, National Electricity Forecasting Report, http://www.aemo.com.au/Electricity/National-Electricity-Market-NEM/Planning-and-forecasting/National-Electricity-Forecasting-Report
Related Analysis
Data Centres and Energy Demand – What’s Needed?
The growth in data centres brings with it increased energy demands and as a result the use of power has become the number one issue for their operators globally. Australia is seen as a country that will continue to see growth in data centres and Morgan Stanley Research has taken a detailed look at both the anticipated growth in data centres in Australia and what it might mean for our grid. We take a closer look.
Energy Dynamics Report - A Tale of Minimum Operational Demand and Wholesale Price declines
The third quarter saw significant price declines compared with the corresponding quarter in 2022 right across the NEM. At the same time with increased output from solar and wind generation inin Queensland’s case, minimum operational demand records were set or equaled in every region. The quarter also saw the highest-ever level of negative price intervals with all regions showing an increase. We dive in to the pricing and operational demand detail of AEMO’s Q3 Quarterly Energy Dynamics Report.
Data centres: A 24hr power source?
Data centres play a critical role in enabling the storage and processing of vast amounts of online data. However they are also known for their significant energy consumption, which has raised concerns about their environmental impact and operating costs. But can data centres be fully sustainable, or even a source of power?
Send an email with your question or comment, and include your name and a short message and we'll get back to you shortly.