

by Panos Priftakis
Interconnectors: Is there a link between Europe and Australia?
Interconnectors are playing an increasingly important role as intermittent renewable capacity grows in Europe. France continues to export low cost baseload power generated predominantly from nuclear plant while Germany and Denmark become more reliant on the interconnectors as their renewable generation share increases.
Denmark's interconnector capacity with its European neighbours is equivalent to the Danish peak-load demand, in contrast to the renewable experiment in South Australia. South Australia is connected to Victoria by two transmission lines that allow it to source approximately 23 per cent of its peak load[i] from Victoria. In 2014-15 the state imported 16.7 per cent of its electricity from Victoria, although following the recent closure of the Northern Power Station the interconnector could become even more important.
Interconnectors in Europe
Interconnectors are a key component of most European energy portfolios. The interconnection of European countries plays a vital role in maintaining the energy balance and security of supply across the region. And with intermittent renewable capacity growing in Europe, interconnectors are expected to play an increasingly important role.
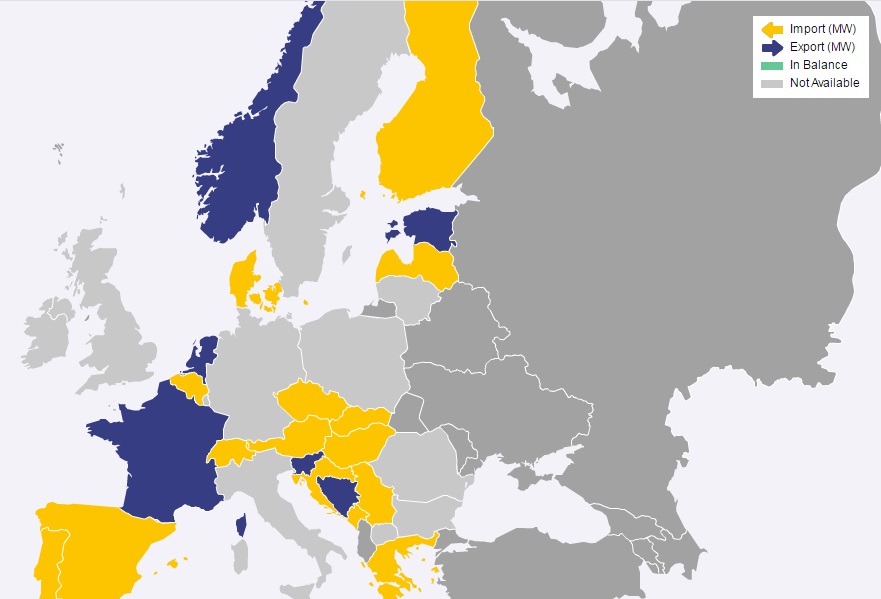
Fluctuations in renewable output, particularly in Denmark and, more recently, in Germany, will need to be supported by generation flexibility from neighbouring markets. Figure 1 below shows the flows between the European countries. Flows from flexible hydro capacity, baseload nuclear generation, gas and flexible thermal capacity will be critical to maintaining system balance.
Figure 1: European Power Flows, May 2014[ii]
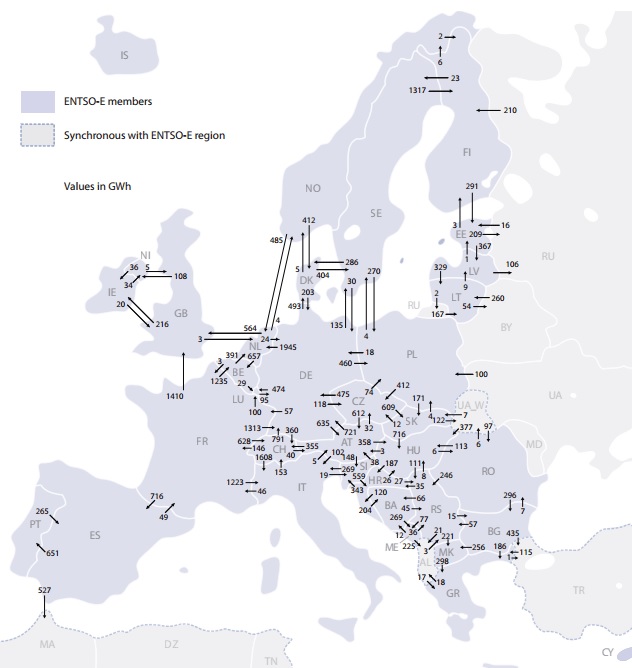
Although the sample is for May 2014, it highlights the exporting status of France. It also shows the dynamic change in direction of some flows, with countries shifting from being net exporters to becoming net importers, most notably in high renewable and hydro generation. In May 2014, Denmark exported 612 GWh, but imported 1,191 GWh compared to France, which exported 6,625 GWh and only imported 301 GWh. The key drivers of the direction of flow would rely on:
- Demand levels and particularly weather sensitive demand;
- Plant availability and hydro storage levels;
- The relative short run marginal costs of thermal plants; and,
- Prevailing output levels of intermittent renewable capacity.
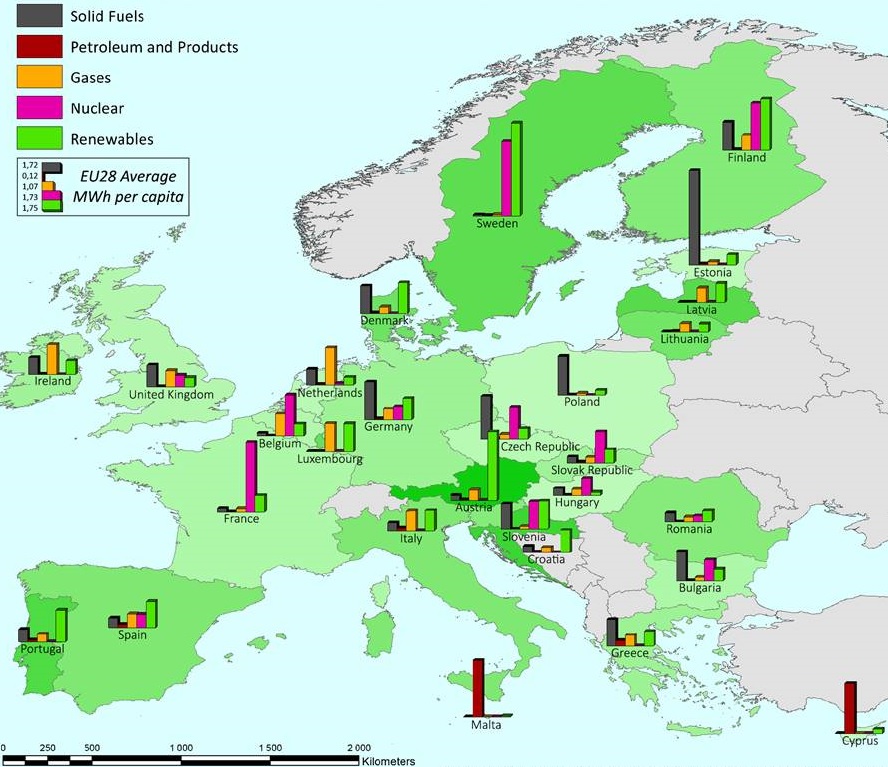
In some cases the flexibility embedded in some types of projects is what drives most of their value. Gas-fired plants are valuable because it is easier to ramp up or ramp down according to the level of market prices. France typically exports low cost baseload power generated from its nuclear plant to its neighbours. Germany, in particular, is likely to become more reliant on this interconnector as it continues its Energiewende policy that seeks to replace fossil fuel and nuclear generation with renewables. In 2014, electricity from fossil fuels (including gas) hit a 35-year low[iii]. Generating capacity in October 2014 was around 177 GWe, comprising 12.1 GWe nuclear, 5.6 GWe hydro, 35.6 GWe wind (0.6 offshore), 38.1 GWe solar, 28.4 GWe gas, 21.2 GWe lignite, 27.8 GWe hard coal and 5.6 GWe biomass, according to the Fraunhofer Institute, a European solar research group[iv]. Figure 2 below shows the electricity production per capita by fuel type across the EU.
Figure 2: Electricity production per capita by fuel type in the EU 2013[v]
Comparison to the National Electricity Market
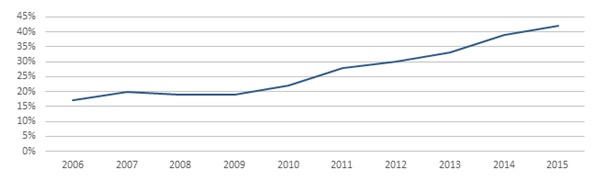
Across the National Electricity Market (NEM) there are six interconnectors linking five states across Australia[vi], compare this to Germany, which is connected to eight countries. When considering Australia and Europe, South Australia and Denmark sit amongst the highest per capita wind generators. Wind generation across South Australia and Denmark account for approximately 40 per cent of their total generation; Figure 3 below shows the growth in the share of wind in Denmark.
Figure 3: Share of wind energy of the total electricity consumption for Denmark[vii]
The Danish energy system can cope with the variability and uncertainty of its large share of wind power due to its close interconnection with Germany, Norway and Sweden. This could increase given that by 2022 another interconnector has been proposed - the Viking Link is a proposal to build a interconnector between the UK and Denmark. Regardless, the current interconnections in Denmark allow it to source the equivalent of its peak load from other countries.
Two illustrative days in 2015 show how some countries can vary between import and export. On 9 July, Denmark’s wind turbines produced 140 per cent of its electricity needs making it a net exporter, while on 9 September when the wind was not available it was a net importer. This though occurred in another six countries which have both high share of hydro and wind generation. This shift in energy flows can be seen in Figures 4 and 5.
Figure 4: Cross-Border Physical Flow – EU 9 July 2015 3-4pm[viii]
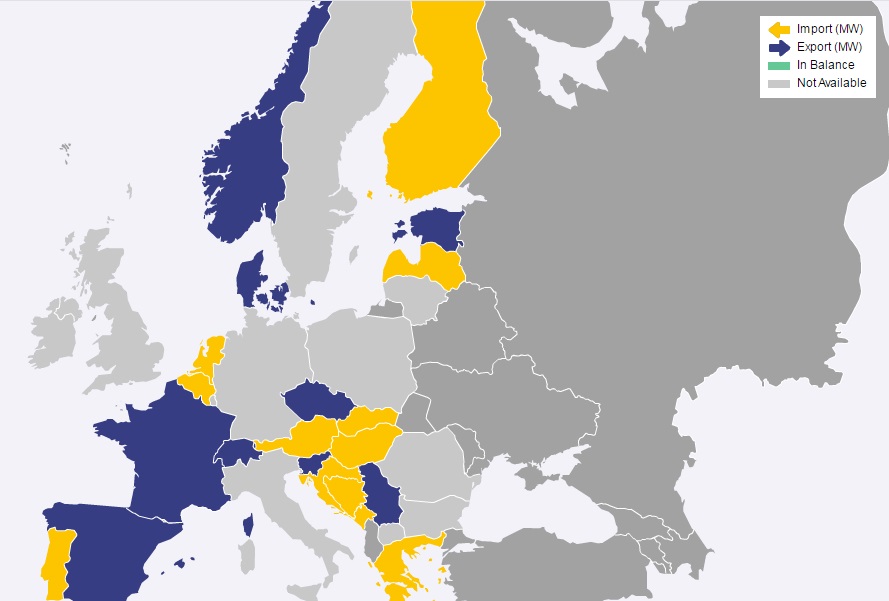
Figure 5: Cross-Border Physical Flow – EU 9 September 3-4pm[ix]
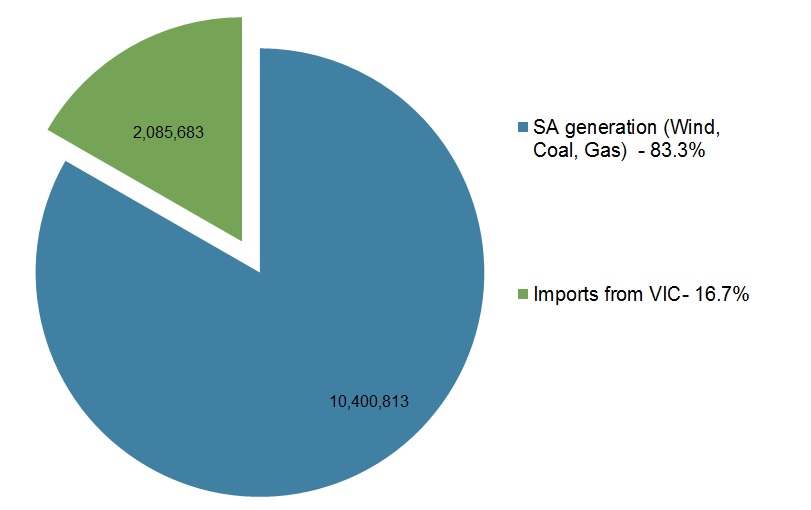
By contrast, the South Australian renewables experiment is more significant given the grid is more constrained. South Australia is connected to Victoria by two transmission lines which allow it to source a maximum of around 23 per cent of peak load from Victoria.[x] As at the end of FY 2015, South Australia imported 16.7 per cent of its electricity from Victoria, but following the closure of the coal-fired Northern Power Station on 9 May 2016 the interconnector could become more vital to meeting the state’s power needs.
Figure 6: South Australia generation market share – 2014-15[xi]
[i] Deloitte, 2015, “Energy markets and the implications of renewables, South Australian case study”, http://www2.deloitte.com/au/en/pages/economics/articles/energy-markets-implications-renewables-sa-case-study.html
[ii] Energiewende Germany website, 2016, http://energytransition.de/
[iii] ibid
[iv] Fraunhofer Institute, 2014, “Fraunhofer Institute for Solar Energy Sytem ISE, Electricity production from solar and wind in Germany in 2014”, https://www.ise.fraunhofer.de/en/downloads-englisch/pdf-files-englisch/data-nivc-/electricity-production-from-solar-and-wind-in-germany-2014.pdf
[v] Desjardins, J, 2015, “Europe’s Electricity Production by Country and Fuel Type”, http://www.visualcapitalist.com/europes-electricity-production-by-country-and-fuel-type/
[vi] AEMO website, http://www.aemo.com.au/Electricity/Network-Connections/Interconnectors
[vii] Danish Wind Industry Association. ‘The Danish Market’ http://www.windpower.org/en/knowledge/statistics/the_danish_market.html> Accessed 05 May 2016
[ix] Source: https://transparency.entsoe.eu/dashboard/show
[x] Energy markets and the implications of renewables – South Australian case study, Deloitte Access Economics, page 3.
[xi] Source NEM Review
Related Analysis
The ‘f’ word that’s critical to ensuring a successful global energy transition
You might not be aware but there’s a new ‘f’ word being floated in the energy industry. Ok, maybe it’s not that new, but it is becoming increasingly important as the world transitions to a low emissions energy system. That word is flexibility. The concept of flexibility came up time and time again at the recent International Electricity Summit held in in Sendai, Japan, which considered how the energy transition is being navigated globally. Read more
Nuclear Fusion Deals – Based on reality or a dream?
Last week, Italian energy company ENI announced a $1 billion (USD) purchase of electricity from U.S.-based Commonwealth Fusion Systems (CFS), described as the world’s leading commercial fusion energy company and backed by Bill Gates’ Breakthrough Energy Ventures. CFS plans to start building its Arc facility in 2027–28, targeting electricity supply to the grid in the early 2030s. Earlier this year, Google also signed a commercial agreement with CFS. These are considered the world’s first commercial fusion-power deals. While they offer optimism for fusion as a clean, abundant energy source, they also recall decades of “breakthrough” announcements that have yet to deliver practical, grid-ready power. The key question remains: how close is fusion to being not only proven, but scalable and commercially viable, and which projects worldwide are shaping its future?
Community Power Network Trial: Potential risks and market impact
Australia leads the world in rooftop solar, yet renters, apartment dwellers and low-income households remain excluded from many of the benefits. Ausgrid’s proposed Community Power Network trial seeks to address this gap by installing and operating shared solar and batteries, with returns redistributed to local customers. While the model could broaden access, it also challenges the long-standing separation between monopoly networks and contestable markets, raising questions about precedent, competitive neutrality, cross-subsidies, and the potential for market distortion. We take a look at the trial’s design, its domestic and international precedents, associated risks and considerations, and the broader implications for the energy market.
Send an email with your question or comment, and include your name and a short message and we'll get back to you shortly.