

by Carl Kitchen
Integrating renewables: An assessment of generation correlation
As more renewable generation has entered the National Electricity Market (NEM) there has continued debate about how to best manage its integration in the power system.
When there is excess electricity supply from renewable sources in one region there is the potential for other regions to draw on the electricity being generated. It is argued that increased interconnection would help smooth supply between regions, but what happens if the adjoining zone has its own renewable generation, and experiences similar weather patterns?
The Clean Energy Regulator has declared that we have effectively met the 2020 Renewable Energy Target (RET), based on the capacity already in place and that under development, and as more states seek to increase the volume of renewable capacity via state-based RETs, so this correlation of weather patterns becomes a more significant factor to consider. Where is the best place to site new wind or solar farms? Where is investment best made in links to bring the generation into the market? It all requires careful planning.
In Australia, the correlation between the output of wind and solar generation has come under detailed scrutiny in a recent assessment by Global-Roam and Greenview Strategic Consulting[i]. Table 1 below explains correlation and its significance when considering its impact on integrating renewables into the NEM.
Table 1: Correlation definition

Source: Generator Report Card
The authors looked at dispatch data for wind and solar over a number of years to 31 December 2018, grouping them into the nearest Renewable Energy Zone (REZ) clusters outlined in the Australian Energy Market Operator’s Integrated System Plan[ii]. (Due to the file size a larger version of Figure 1 can be found at this link.)
Figure 1: REZ Generator Correlation
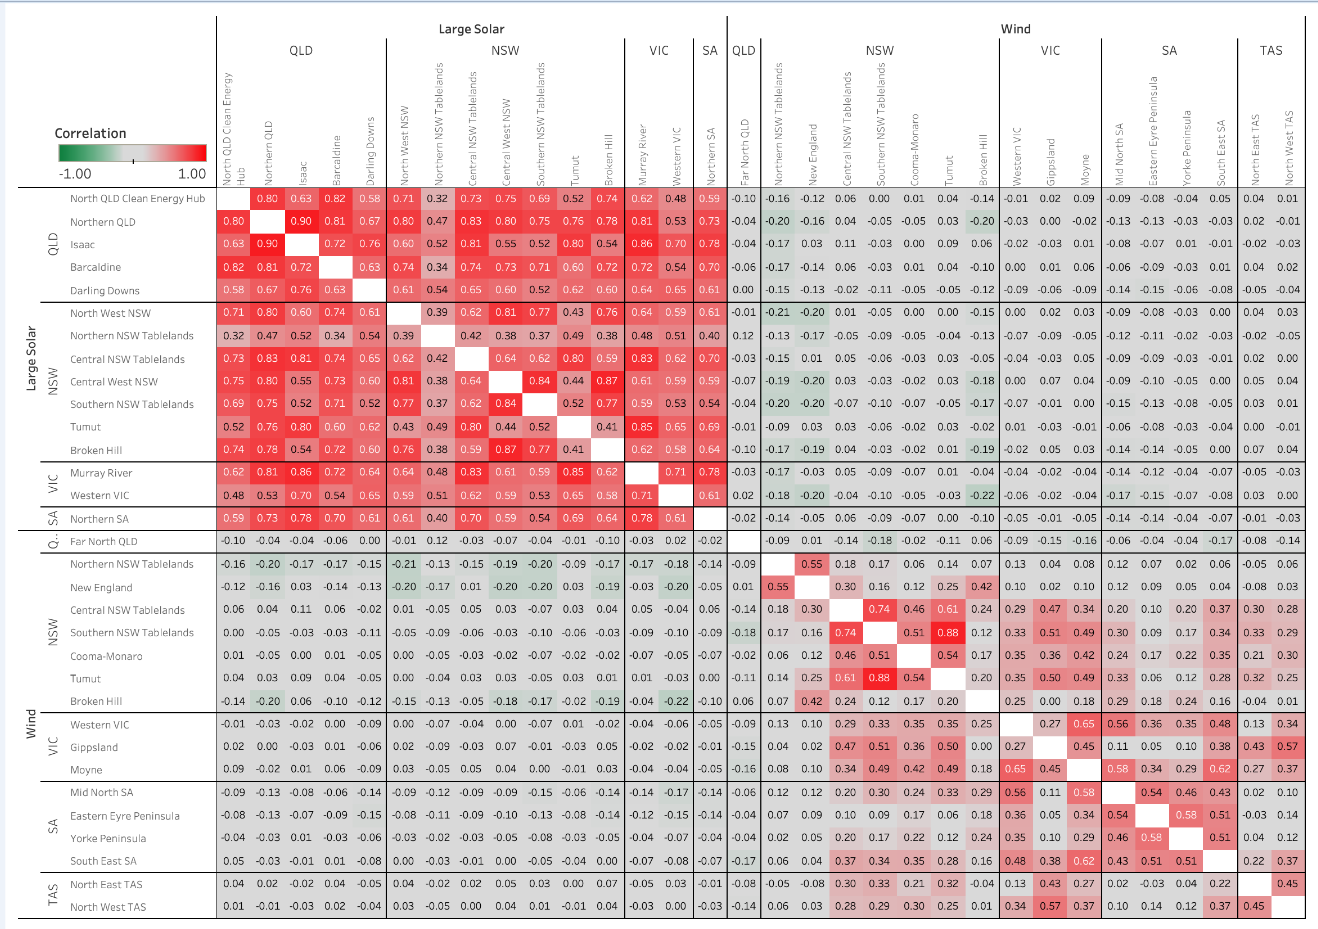
Figure 2 below looks at wind and shows a strong correlation of generation between adjoining Renewable Energy Zones, with production generally correlated with factors above 0.5, particularly through NSW. The report card notes that correlation is reasonable between Victoria and Tasmania, and Victoria and NSW, although NSW and Tasmania have a relatively weak correlation. “Of critical importance, there are no ‘green’ zones: areas we would expect to see anti-correlation to highlight wind increasing somewhere whilst decreasing in other areas.”
Figure 2: REZ Correlation of Wind (NEM)

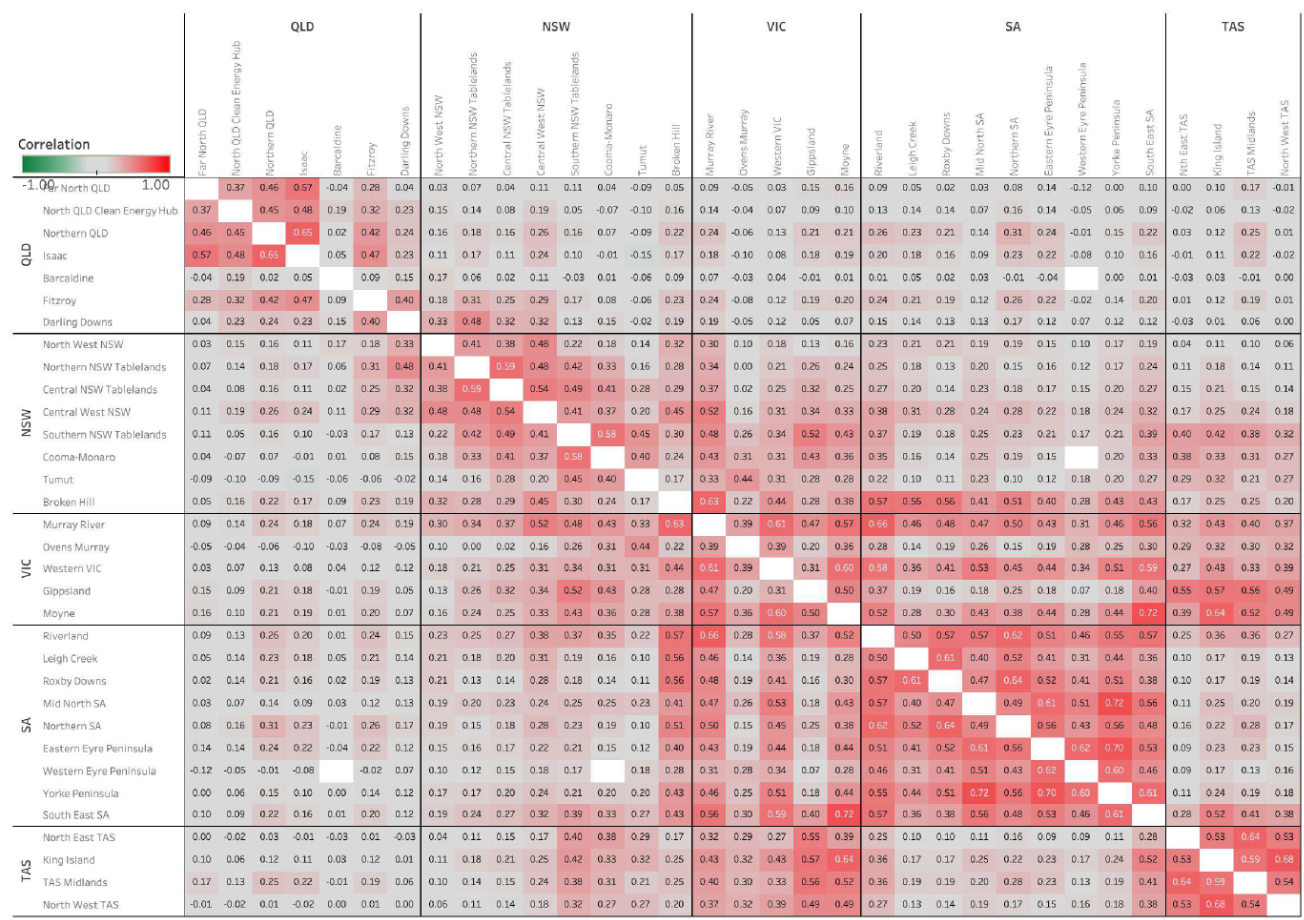
The authors applied the same methodology to 11 years of Bureau of Meteorology weather data matched to the nearest weather station for the REZs. The results “highlight the same pattern of adjacent REZ’s having strong correlation with nearby / adjacent zones (as would be expected and especially in South Australia), but that again, there is very little ‘green’ highlighting anti-correlation.” (Due to the file size use this link to see Figure 3 in larger format).
Figure 3: REZ correlation (Using MW wind output in 2018)
 Based on its analysis the Generator Report Card commented:
“We have not seen strong statistical evidence based on historical production profiles to support the statement that ‘it’s always windy or sunny somewhere in the NEM’. Whilst there are some discrete examples in time… the statistical patterns indicate more randomness than anti-correlation at a NEM-scale over a longer time range. The implications for the upgrade justifications for some transmission interconnection must take account of these sorts of outcomes moving forward”.
The authors also noted:
“We have seen instances in the past where aggregate wind output has fallen to very low levels across the NEM – despite a growing fleet of wind farms being developed. The long-range historical data we have access to that covers the NEM does not give confidence that simply building out a more diversified fleet of wind farms will change that underlying characteristic NEM 2.0 will need to ensure that high degrees of intermittency are explicitly catered for in dispatch and pricing design decisions, and that any external environmental pricing signals are equally geared to meeting consumer demand when required.”
To reduce the times when “the sun does not shine and wind does not blow” they argue we will need to be looking for locations where there are strong anti-correlations (down near -1) that can subsequently be matched with transmission interconnection.
“Transmission links between regions that are moving together (positively correlated) will be sub-optimal from an investment perspective, irrespective of who is paying for the upgrade.
“To the extent that anti-correlation exists, this should be seen as an advantage to particular pairs of locations or assets and amenable to transmission upgrades and is discussed to some extent in Appendix 1 of the AEMO 2018 ISP.”
European assessments
There has been work in the European Union to better understand the wind correlation between different parts of the EU power system. This wind energy report[iii] noted that various studies had shown that a large geographic spread of installed capacity can reduce wind power variability and smooth production.
It also reported that the variability could be helped by electricity interconnection and storage systems, but that these were not totally flexible (and in the case of battery storage were still in development at the large-scale needed), “so it is essential to understand the wind power correlation in order to address power system constraints in systems with large and growing wind power penetrations”.
The report analysed three years of historical hourly wind power generation data from 10 countries and compared it with two other studies – one looked at the Nordic region and the other considered the USA.
“The findings show that similar general correlation characteristics do exist between European country pairs. This is of particular importance when planning and operating interconnector flows, storage optimization and cross-border power trading.”
Conclusion
The Australian correlation work undertaken by Global-Roam and Greenview Strategic Consulting is important in helping to better assess the best ways to manage the energy transition[iv]. Further assessment of correlation will be important as we seek to integrate more renewable generation in the grid. It will assist in evaluating renewable energy zones and determining likely output and financial returns for wind and solar farms, and more importantly these findings need to be incorporated into the business cases for new transmission investment. There is no point in increasing transmission if the two linked regions experience similar patterns of over-supply and under-supply.
Instead it is important for project developers to learn from the correlation data, and consider how best to deal with the natural variations, for example by installing (or contracting) more storage – whether this be in form of pumped hydro, large-scale batteries, or other developing technologies. While the promise of increased renewable energy has a bright future, it’s less appealing on windless, cloudy days.
See also "Assessing the diversity of intermittent (wind and solar output) as one piece of analysis in the Generator Report Card" Watt Clarity
[i] Generator Report Card, Global-ROAM and Greenview Strategic Consulting, May 2019. http://www.wattclarity.com.au/other-resources/detailed-analysis-and-reports/generator-report-card-2018/
[ii] Integrated System Plan 2018, Australian Energy Market Operator
[iii] A spatial and temporal correlation analysis of aggregate wind power in an ideally interconnected Europe, 2017
[iv] http://www.wattclarity.com.au/articles/2019/07/assessing-the-diversity-of-intermittent-wind-and-solar-output-as-one-piece-of-analysis-in-the-generator-report-card/
Send an email with your question or comment, and include your name and a short message and we'll get back to you shortly.