

by Panos Priftakis
Energy demand: What’s the right path?
Despite a rise in energy demand in Queensland, a significant drop in average energy use across Victoria and South Australia in the 2016-2017 year to date has led to an overall reduction in average energy use across the National Electricity Market (NEM). This comes at a time when a CSIRO report outlined ambitious pathways for key low emissions technologies that highlight how energy productivity can reduce energy use and lead to lower bills.
Average demand changes across the NEM
In the year to date Victoria and South Australia’s average energy use has dropped significantly. This is the result of an increase in residential rooftop solar photovoltaic (PV) installations and a reduction in demand by large industrial facilities - some of these have closed while others have reduced their energy use. There has also been a large uptake of rooftop solar PV installations across Queensland in recent years. Despite these factors the average demand in Queensland has increased, partly due to demand from the LNG export
The drop in energy use in Victoria and South Australia has been so significant that although growth has occurred in Queensland and New South Wales, total energy use across the NEM has fallen. Figure 1 and 2 shows the change in demand across the NEM states and the NEM overall.
Figure 1: Average demand (GW) across NEM states 2010 - 2017
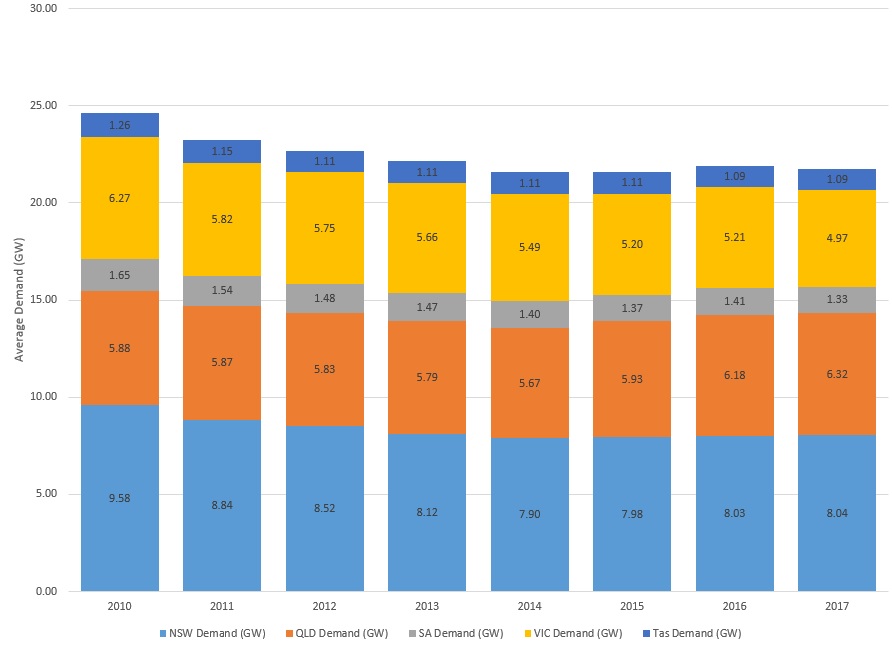
Source: NEM Review – Global-Roam, 2017
Figure 2: NEM Average demand (GW), 2010 - 2017
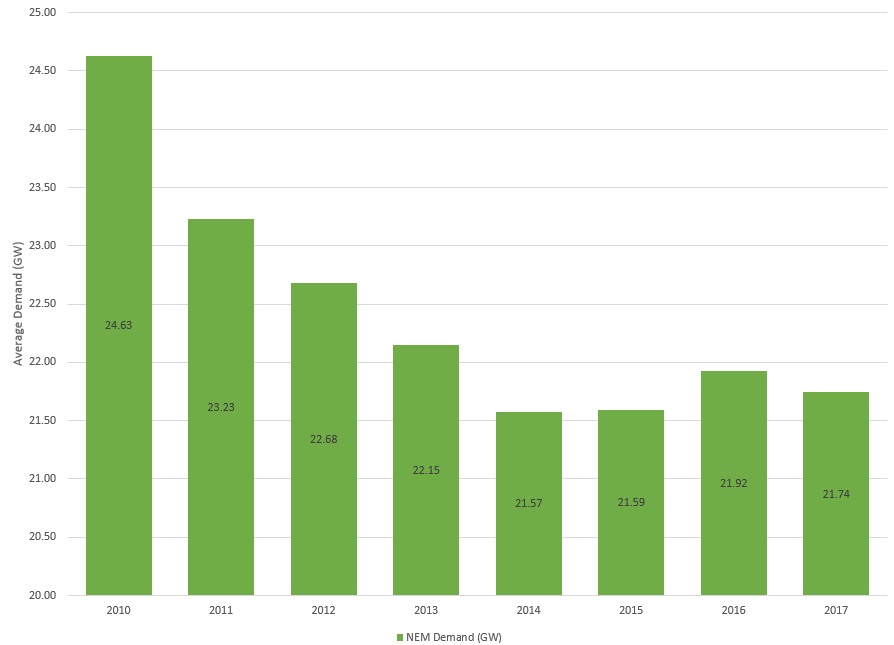
Source: NEM Review, 2017
South Australia and Tasmania have experienced economic headwinds (coupled with serious security issues that dented annual demand) over the past few years which helps explain the continued decline in demand in those states. In Victoria, rising energy efficiency, likely a consumer response to the rise in electricity costs and structural adjustments in industry with the downturn in mining and manufacturing, have all contributed to the fall in demand.
Victoria’s electricity demand also fell as a result of the modest demand growth for aluminium[i] and the closure of Point Henry aluminium smelter in 2014. In 2016, the Portland aluminium smelter reduced production following a blackout in December, but Alcoa will continue to operate the Portland aluminium smelter in the near term. The outlook for aluminium production is flat for 2017-18[ii].
There has been a significant change in average demand over the past 10 years in Queensland. Six years ago Victorian average demand was on par with Queensland, but in recent years Victoria’s energy demand has only equated to about 80 per cent of Queensland’s demand level. Together Victoria and South Australia’s average energy demand equate to the level of demand in Queensland.
Figure 3: Average QLD demand vs combined SA and VIC demand 2010-2016
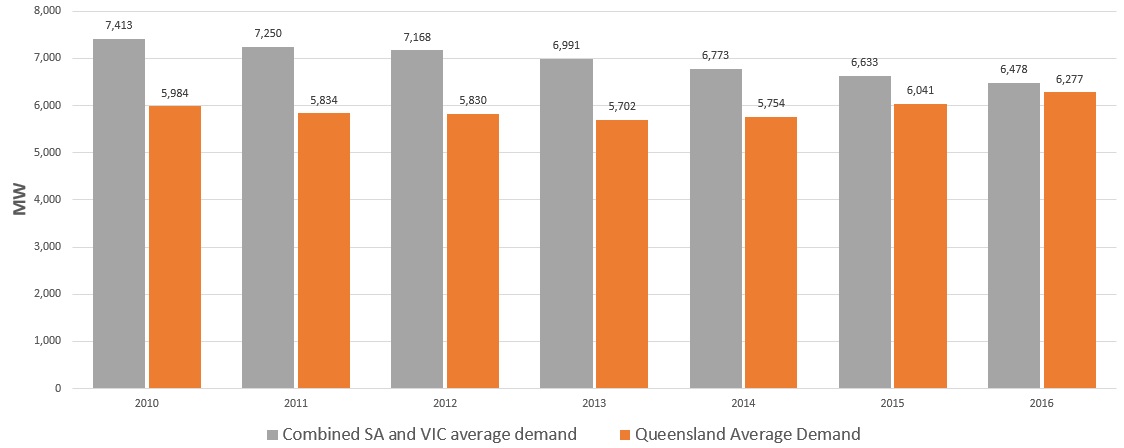
Source: NEM Review – Global-Roam, 2016
With price increases across most regions, we could see a more significant contraction in residential demand as consumers look to reduce energy bills. There is also a possibility of some industrial and commercial demand completely exiting the market as a result of high gas and electricity prices.
Ambitious improvements in energy productivity
The recent CSIRO Low Emissions Technology Roadmap report[iii] forecasts ambitious pathways with faster improvements in energy productivity which it expects will to lead to significantly lower average household electricity and gas costs by 2030. In the electricity sector, the CSIRO expects higher energy productivity to reduce the amount of electricity required and with a consequent impact on bills. The CSIRO pathways illustrate how technologies could be used to improve productivity and below is their summary of these[iv].
Figure 4: Summary of pathways in the CSIRO’s Low Emissions Technology Roadmap
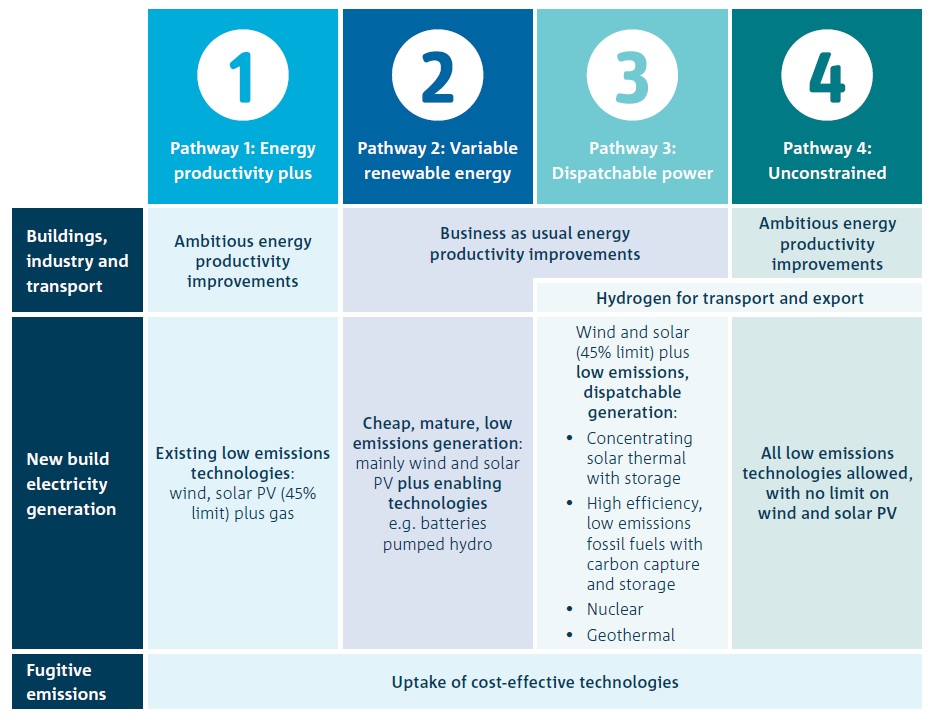
Source: CSIRO, 2017
The average residential customer energy (electricity and gas) bill for each pathway is shown in Figure 5. According to the CSIRO report the pathways with the greatest energy productivity have the lowest bills; bills in Pathways 1 and 4 are lower than in Pathways 2 and 3 and remain lower than the no abatement scenario to 2030.
Figure 5: CSIRO comparison of annual energy bill (electricity + gas) across pathways ($ per household) including capital costs for high efficiency equipment in Pathways 1 and 4
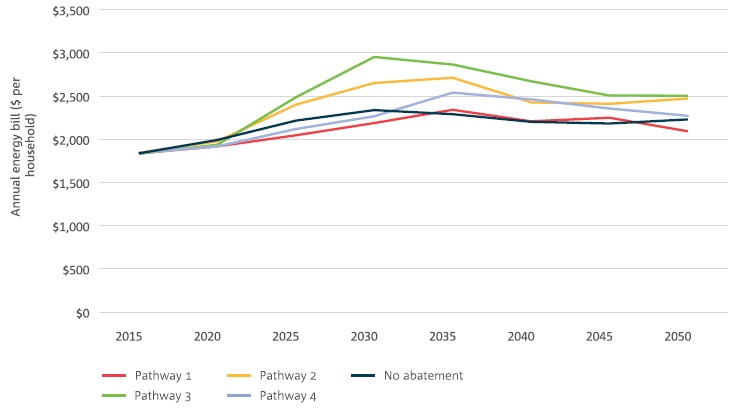
Source: CSIRO, 2017
Bills are lower in Pathways 1 and 4 due to lower retail prices and lower electricity demand. The lower retail prices are expected to be driven by faster improvements in energy productivity in transport and direct combustion, which will result in a requirement for less carbon abatement from the electricity sector to meet our 2030 emissions target.
[i] Office of the Chief Economist, December 2016, Resources and Energy Quarterly, https://industry.gov.au/Office-of-the-Chief-Economist/Publications/Documents/req/REQ-December-2016.pdf
[ii] Office of the Chief Economist, December 2016, Resources and Energy Quarterly, https://industry.gov.au/Office-of-the-Chief-Economist/Publications/Documents/req/REQ-December-2016.pdf
[iii] CSIRO, June 2017, “Low Emissions Technology Roadmap”
[iv] ibid
Related Analysis
Certificate schemes – good for governments, but what about customers?
Retailer certificate schemes have been growing in popularity in recent years as a policy mechanism to help deliver the energy transition. The report puts forward some recommendations on how to improve the efficiency of these schemes. It also includes a deeper dive into the Victorian Energy Upgrades program and South Australian Retailer Energy Productivity Scheme.
The return of Trump: What does it mean for Australia’s 2035 target?
Donald Trump’s decisive election win has given him a mandate to enact sweeping policy changes, including in the energy sector, potentially altering the US’s energy landscape. His proposals, which include halting offshore wind projects, withdrawing the US from the Paris Climate Agreement and dismantling the Inflation Reduction Act (IRA), could have a knock-on effect across the globe, as countries try to navigate a path towards net zero. So, what are his policies, and what do they mean for Australia’s own emission reduction targets? We take a look.
UK looks to revitalise its offshore wind sector
Last year, the UK’s offshore wind ambitions were setback when its renewable auction – Allocation Round 5 or AR5 – failed to attract any new offshore projects, a first for what had been a successful Contracts for Difference scheme. Now the UK Government has boosted the strike price for its current auction and boosted the overall budget for offshore projects. Will it succeed? We take a look.
Send an email with your question or comment, and include your name and a short message and we'll get back to you shortly.