Claims blow across South Australian market
The Melbourne Energy Institute recently released a paper Winds of change – An analysis of recent changes in the South Australian electricity market. The key findings of the report are that the rise in renewable generation in South Australia over the last decade has “contributed to decisions to close brown coal operators and increased South Australian dependence on imports and in times of low win output, gas”[i]. In turn, they note the changes in the eastern Australian gas market, which is adapting to new dynamics and thus more volatile prices. This has a knock-on impact in a region that has a high proportion of gas generation. The implications of the capacity closures of brown coal on competition are also examined, with the paper declaring the market “severely concentrated” when there is no wind. The report makes no firm recommendations, but suggests that “particular attention” should be paid to:
- Potential for market power to be concentrated through the energy transition; and
- Diversification of low emission generation and storage; and
- Alignment of national energy policy, recognising linkages such as that between gas export and the Renewable energy Target; and
- Co-ordinated system planning of transitional arrangements.
Prices – an overview:
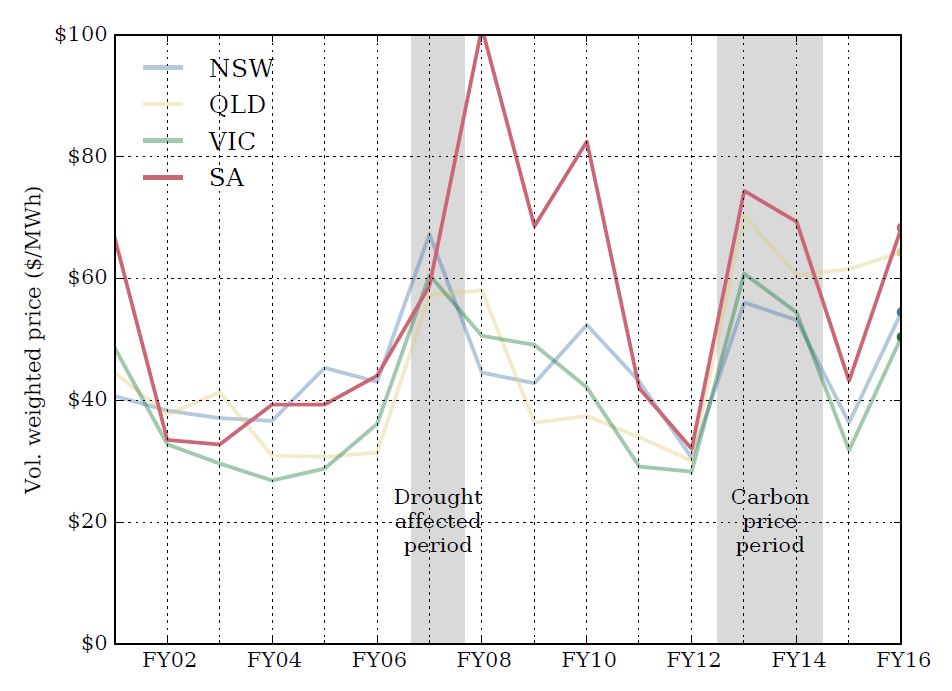
Figure 1: Annual average volume weighted prices, selected NEM regions

Source: Winds of Change, p.7
Figure 1 shows the challenges of interpreting the drivers of prices and how it depends on the chosen start period. Two periods stand out and are highlighted on the chart – the drought around FY07-08 and the carbon pricing period, of FY12-14. While the paper notes prices in South Australia today are lower than FY08, they are also higher than, say FY06. Aside from the anomalous periods, they also describe a broader trend, or “capacity cycle”. The addition of zero marginal cost generation like wind and solar induces the well-known 'merit order effect' (as they note new fossil fuel or hydro generation could do the same if it could underbid existing plant). This in turn eventually causes the marginal generator to exit, which tightens the supply demand balance and prices rise on average.
The other point about Figure 1 is that it indicates part of the reason that South Australia has proportionately more RET plant than the rest of the NEM. The paper attributed this to good wind resources and a favourable planning regime. But the other advantage is that South Australia has historically had higher prices, so the required subsidy is lower for a given plant cost. As more wind goes into South Australia, given that wind output is somewhat correlated, each plant’s energy revenue reduces so the required subsidy rises and investment goes elsewhere. This is appropriate, given the design of the RET scheme was to find the best places nationally for new renewable investment. This should have acted as a natural market “brake” on further investment in wind. Unfortunately the ACT’s reverse auction scheme has come over the top with its fixed price payment to underwrite the latest wind farm developments at Hornsdale.
The end of baseload?
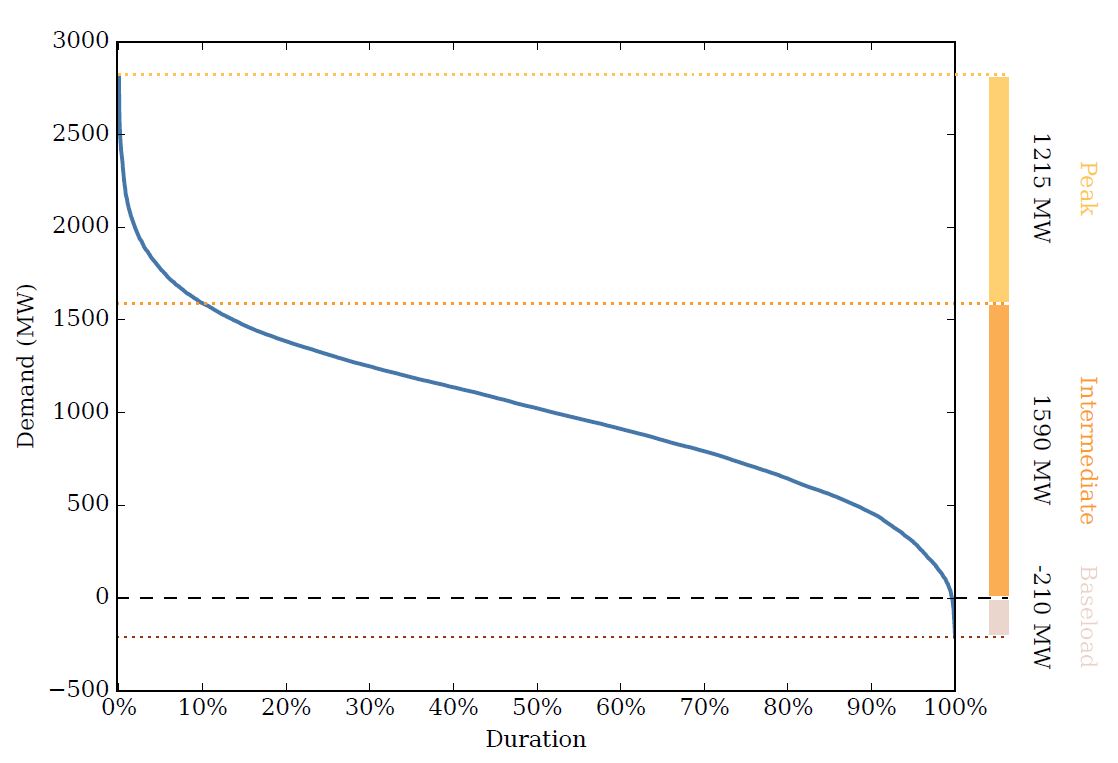
The paper argues that South Australia’s load curve, net of intermittent resources such as wind and solar, means it is no longer in need of conventional baseload electricity. This is consistent with the fact that the coal plants at Port Augusta, which were designed to run as baseload, have found themselves unable to operate profitably and so have closed.
Figure 2: South Australia’s load curve, net of non-scheduled/semi-scheduled wind

Source: Winds of Change, p.10
The report’s analysis of the load curve suggests that the installation of over 1500MW of wind generation has resulted in a reduction of peak capacity required from other plant of only c. 65MW. Solar PV is not analysed (it is effectively netted off demand), but is likely to be more aligned with peaks. By shifting the peak later in the day, though, rooftop PV’s contribution to peak demand faces diminishing returns. To be clear, this does not mean wind is not useful – when available it provides a relatively low cost source of zero emissions electricity, but it is useful to understand its limitations as a resource.
Competitive dynamics
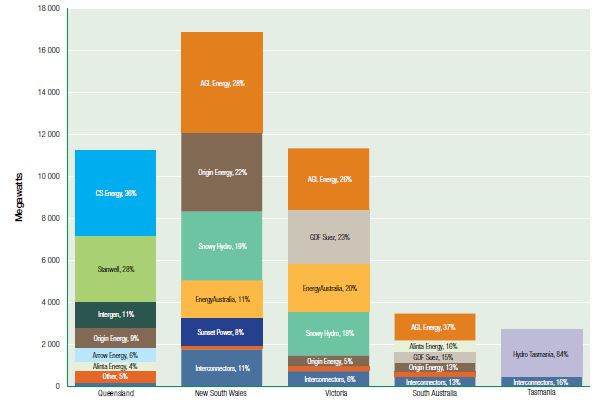
While the paper acknowledges that the whole design of an energy only market like the NEM is predicated on transient market power (otherwise there would likely be no scope for some generators to recover their capital costs), it contends that the recent situation in South Australia goes beyond an efficient equilibrium. The paper references the AER’s analysis of ownership of generation in the NEM (see below), which it has adjusted for the closure of Alinta’s plant and the part mothballing of Engie’s Pelican Point.
Figure 3: Generator market shares by region

Source: AER, 2015 State of the Energy Market, p.42
Their analysis of competition is predicated on wind not adding to competition materially (see peak demand point, above, wind’s impact on competition is limited to the extent to which it reliably contributes to peak demand). Rooftop solar also has no real impact. Interconnection in Victoria is accounted for, noting that the Heywood interconnector is now the 2nd largest source of capacity for South Australia after Torrens Island. In this respect, the analysis contradicts that frequent claim that renewables are good for competition in the energy market[ii]. Using the Herndahl-Hirschman index (HHI) index of market concentration they estimate that South Australia is severely concentrated.
The report also discusses other elements of the NEM rules that may impact price outcomes, including rebidding and the actions of non-scheduled generation. Such issues are well understood and are being addressed through rule changes, as noted below.
It may in practice be more accurate to describe South Australia as a market of two states. When the wind is blowing and the sun is shining, there is plenty of competition from generators large and small to keep prices low. When these resources are absent, there is a much smaller number of dispatchable thermal generators available. The latter is a corollary of the former, noting that this dynamic has contributed to the closure and withdrawal of some of the thermal plant. In other words, lower competition at times is an outcome of the transition to more intermittent plant.
What are policymakers doing about competition concerns?
The rhetoric associated with the release of the report may have given the impression that generators were free to “game” the market unchecked by regulators. Nothing could be further from the truth. The AER has a monitoring role to oversee wholesale markets, which has recently been beefed up. This role gives it the power to review market outcomes and take enforcement action against any wrongdoers. It also reports regularly on outcomes in both the gas and electricity markets. In any case the NEM is arguably the most transparent market for any good or service in Australia, with bidding, rebidding and prices for each dispatch interval published by the market operator.
Further, there is an ongoing program of reviews by the AEMC (via rule change proposals that can be lodged by any party) to ensure the market is working as efficiently as possible and minimise opportunities for gaming by any participant. These include
- Rules amended to ensure bidding in good faith; and
- Rule change proposed to align settlement and dispatch; and
- Rule changes proposed to require more transparency from non-scheduled generators and large loads.
There are pros and cons to each of these, but they serve to illustrate that maintaining the competitive dynamic of the NEM is a “live” process.
Potential solutions
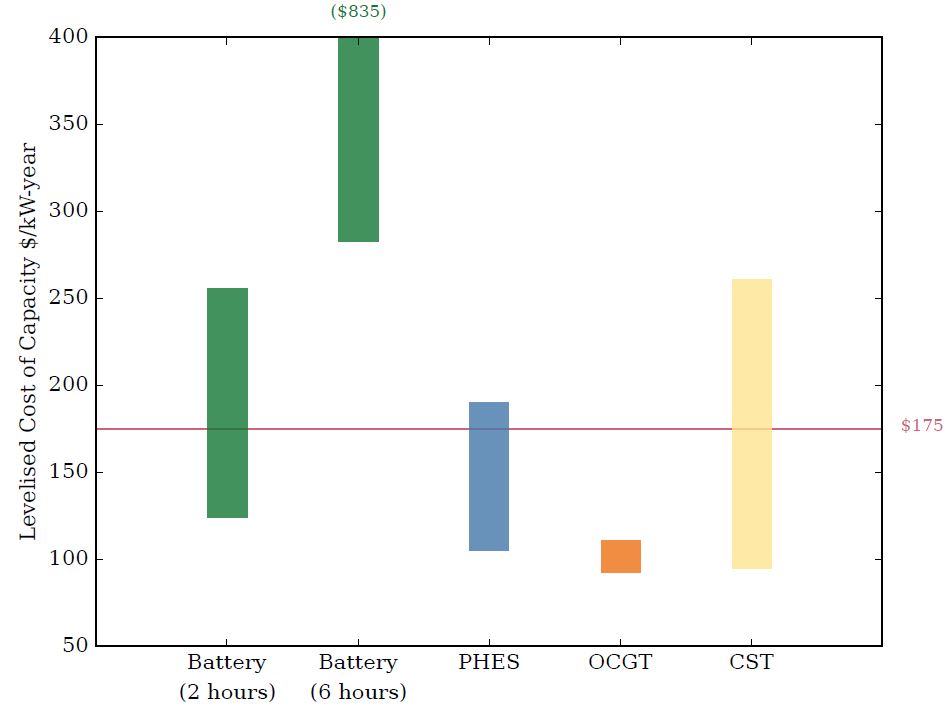
The report canvasses a few of these with varying degrees of enthusiasm. The report refers to the value of new flexible plant – potentially including storage. Although the cost ranges are quite wide, a conventional Open Cycle Gas Turbine (OCGT) appears likely to still be the cheapest such option.
Figure 4: Levelised cost of capacity of selected technologies

Source: Winds of Change, p.40
Obviously such new investment needs a price signal. More frequent price spikes are clearly the type of signal that will induce new investment – in other words, this is how the capacity cycle works. The red line on the figure 4 represents the value of a $20/MW cap contract – i.e. costs below the red line would make an investment viable at that price.
Interestingly the alternative source of a price signal, a capacity market, is quickly dismissed. A capacity market is certainly no panacea. It would largely be a substitute for the financial markets that currently do the job of providing peaking generators with a more stable income stream, so the case for a capacity market would largely be if the liquid nature of South Australia's financial markets were a material concern.
The key concern expressed by the paper about a capacity market is that it is a return to central planning, carrying the risk of distortions from political interference. This concern should be put in the context that energy and climate change policy already exhibits these characteristics. In fact policy risk may ultimately be a driver for more secure revenue arrangements for generators of all types. Similar issues arise with most renewable energy support schemes. At the very least, a well-designed capacity market is likely to drive more efficiency than a regulated arrangement[iii].
The report provides no detail on its suggestion of transitional arrangements with respect to market power might entail, given the AER’s existing role.
The impact of greater interconnection was beyond the scope of the report’s analysis.
Conclusion
The papers concerns over competition are indicative of challenges of the energy transition, along with power system security, effective network regulation, sending the right price signals to distributed energy resources, and others. None of these challenges are the fault of individual generators, let alone a rooftop photo voltaic (PV) system, as no individual generator is responsible for the overall outcomes of the whole system. But these challenges suggest that our current approach of simply targeting lowest cost renewable energy is sub-optimal. Ideally, policy should be reframed to reflect that the key goal is to reduce emissions, but at lowest system cost while maintaining reliability and security of supply.
[i] http://energy.unimelb.edu.au/news-and-events/news/winds-of-change-an-analysis-of-recent-changes-in-the-south-australian-electricity-market, p4
[ii] “Transition to 100% renewable energy: inevitable, essential, achievable” - media release from a group of environmental campaigners.
[iii] See for example this analysis of the PJM market in the US: http://www.pjm.com/~/media/768E4AC9442A428AA83776AFDBF48929.ashx
Related Analysis
Certificate schemes – good for governments, but what about customers?
Retailer certificate schemes have been growing in popularity in recent years as a policy mechanism to help deliver the energy transition. The report puts forward some recommendations on how to improve the efficiency of these schemes. It also includes a deeper dive into the Victorian Energy Upgrades program and South Australian Retailer Energy Productivity Scheme.
The return of Trump: What does it mean for Australia’s 2035 target?
Donald Trump’s decisive election win has given him a mandate to enact sweeping policy changes, including in the energy sector, potentially altering the US’s energy landscape. His proposals, which include halting offshore wind projects, withdrawing the US from the Paris Climate Agreement and dismantling the Inflation Reduction Act (IRA), could have a knock-on effect across the globe, as countries try to navigate a path towards net zero. So, what are his policies, and what do they mean for Australia’s own emission reduction targets? We take a look.
Is increased volatility the new norm?
This year has showcased an increased level of volatility in the National Electricity Market (NEM). To date we have seen significant fluctuations in spot prices with prices hitting both maximum price caps on several occasions and ongoing growth in periods of negative prices with generation being curtailed at times. We took a closer look at why this is happening and the impact this could have on the grid in the future.
Send an email with your question or comment, and include your name and a short message and we'll get back to you shortly.


