

by Duncan MacKinnon
Can you put a price on customer reliability?
Yes, you can. And on 18 December the Australian Energy Regulator (AER) did so, releasing its final report on the Values of Customer Reliability (VCR).[i] With the media reporting that reliability is in jeopardy, we take a look at the report’s findings.
Why was the report necessary?
On 22 December 2017 the COAG Energy Council submitted a rule change proposal to the Australian Energy Market Commission (AEMC) for the AER to take responsibility for VCRs.[ii] The justification for the rule change was that nationally consistent and regularly updated VCRs should be established for use in setting appropriate network reliability standards, network planning, and economic regulation of network services, as well as informing the wholesale market settings, such as market price caps. The AER was obliged to publish its first findings by December 2019.
How was the work done?
The AER considered “standard outages”, which were defined as outages up to 12 hours in duration. (It will consider “widespread and long duration outages” (WALDOs) later this year using modelling techniques.)
The standard outage VCRs for small customers were determined using a combination of contingent valuation and choice modelling survey techniques.
Contingent valuation was used to determine customers’ willingness to pay to avoid a baseline outage scenario (defined as two localised one hour outages in a year, occurring in winter in off-peak times).
This was followed up by choice modelling, which was used to determine the increment (or decrement) in the value respondents placed on specific outage attributes in addition to the baseline outage scenario. Attributes tested in the choice model were peak (7am-10am and 5pm-8pm) and off-peak time of day, season (winter/summer), day of week (weekday/weekend), severity (localised/widespread) and duration (1 hour, 3 hours, 6 hours, or 12 hours).
The published VCR values will be escalated annually using a CPI-x approach, with x representing the annual change in customer reliability preferences (which may alter due to factors such as widespread home battery uptake). The value x will initially be set at zero due to a lack of available information.
For business sites consuming more than 10MVA peak demand per annum (about 300 sites in the National Electricity Market), the AER used a direct cost survey approach.
What were the findings?
The AER stressed that although it used the same survey techniques as the previous AEMO work,[iii] the results are not directly comparable, due to changes in the methodology, changes in customer preferences or a combination of both. The direct cost survey results are also reflective of a change in the range of customers sampled.
Nevertheless, comparisons will be made, and the AER itself published a table in the report showing the results from the two studies, reproduced here.
Figure 1: NEM and State VCR values and comparison to AEMO 2014 results
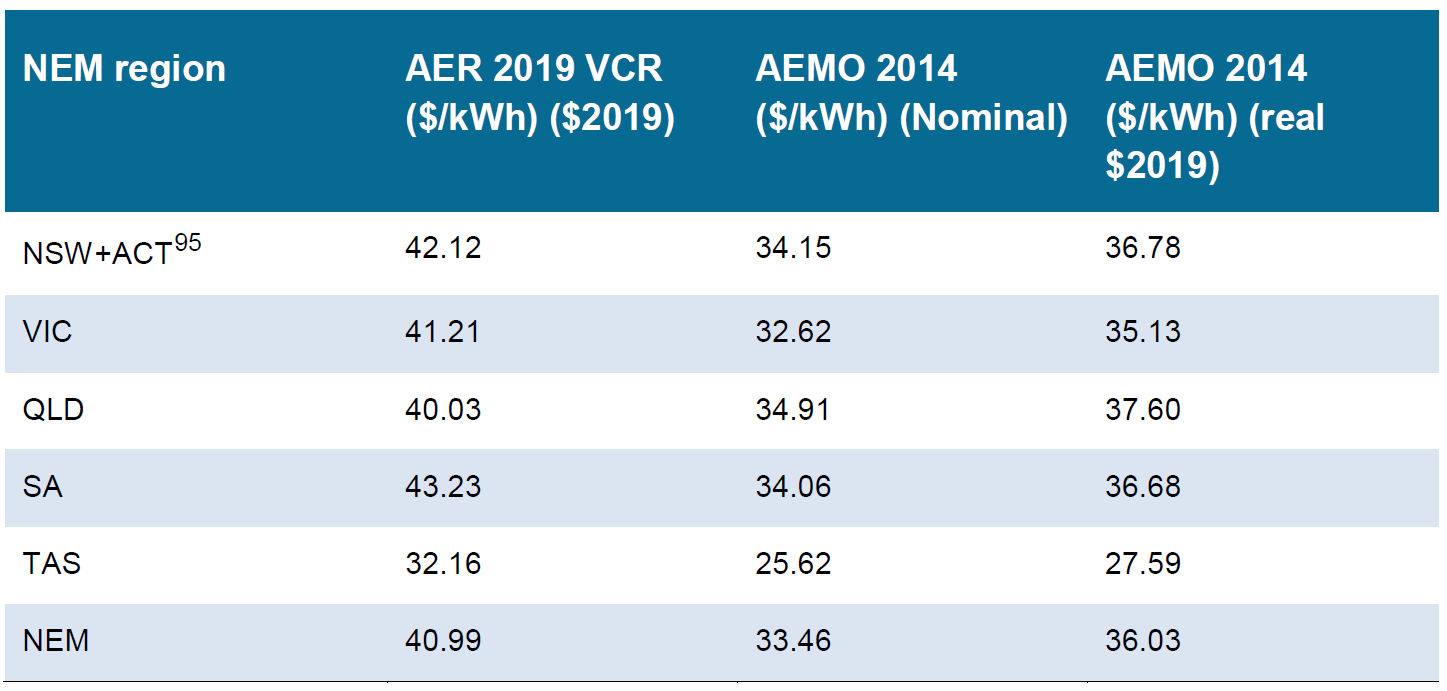 Source: AER (p.71, Table 5.22)
The AER’s key findings were:
- VCRs were similar to AEMO’s;
- business customers’ VCRs were higher than residential customers’ VCRs (which is consistent with previous studies);
- residential customers prefer to avoid longer outages, and outages which occur at peak times (defined as 7am-10am and 5pm-8pm). However, residential values were lower in 2019 than in 2014 with the exception of customers in suburban Adelaide;
- there was an increase in the industrial VCR, which resulted in a small increase in the NEM and State VCRs compared with 2014. The AER notes that this is because industrial customers use proportionally more energy relative to other customer segments and so have a greater influence on the finally-determined load-weighted VCRs; and
- VCRs amongst the approximately 300 business sites that consume the highest amount of energy in the NEM can vary greatly depending on sector.
How do the findings compare with other jurisdictions?
Comparison with other jurisdictions is nigh impossible. Ignoring the geographical and climatic differences, overseas studies have used different outages times and durations, therefore there is no way to make a meaningful comparison. However as a point of reference, the following chart shows European domestic value of lost load ranges (10 euros is about A$16.)
Figure 2: Estimated domestic VoLL ranges for EU member states by region
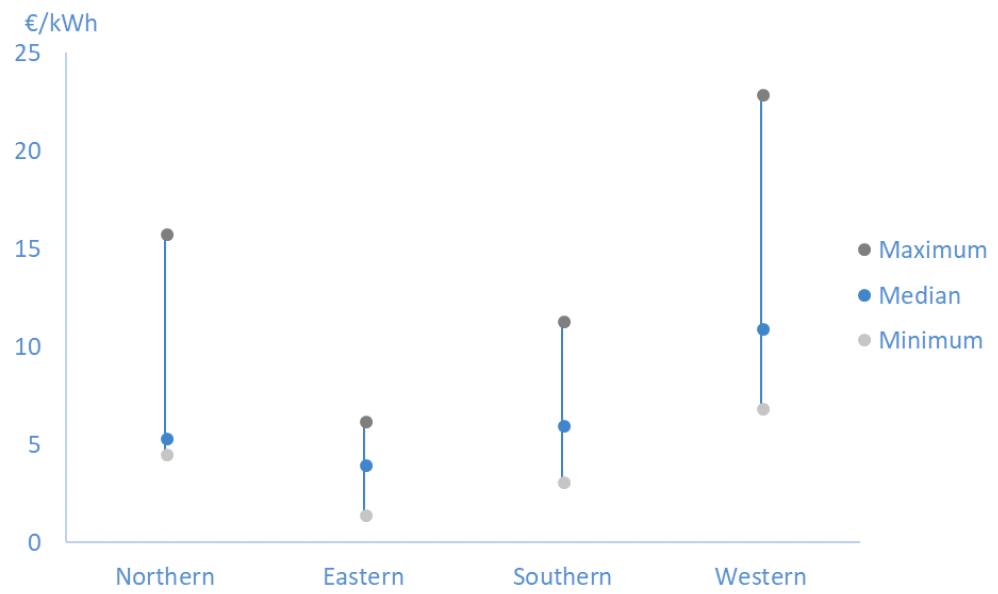 Source: Cambridge Economic Policy Associates Ltd, Study on the Estimation of the Value of Lost Load of Electricity Supply in Europe, 6 July 2018, p.42, Figure 6.3
What happens now?
The AER is continuing its work programme, and expects to publish VCRs for widespread and long duration outages early in 2020. It will update VCRs using the CPI-x methodology annually, until such time as it reviews its VCR methodology and publishes new VCRs, which it is obliged to do at least once every five years.[iv]
In the meantime, the VCRs may be used in a number of applications, including:
- RIT-T assessments;
- the determination of market settings, such as the reliability standard;
- informing RERT procurement;
- assessing network business revenue proposals;
- setting transmission and distribution reliability standards and targets;
- informing reviews of the system restart standard;
- informing the assessment of requests to declare certain risks as protected events; and
- determining load shedding priorities and jurisdictional compensation mechanisms.
[i] Australian Energy Regulator, Values of Customer Reliability – Final Report on VCR Values, December 2019
[ii] https://www.aemc.gov.au/sites/default/files/2018-05/Rule%20change%20request.pdf
[iii] Available at https://www.aemo.com.au/Electricity/National-Electricity-Market-NEM/Planning-and-forecasting/Value-of-Customer-Reliability-review
[iv] National Electricity Rule 8.12(g)(2)
Send an email with your question or comment, and include your name and a short message and we'll get back to you shortly.