

by Panos Priftakis
Are energy efficiency measures working?
The amount of global energy used per unit of gross domestic product (GDP) improved by 1.8 per cent in 2015[i]. However the global progress on energy intensity was still too slow, unable to reach a sustainable pathway toward a decarbonised energy system, according to the International Energy Agency (IEA). The IEA’s Energy Efficiency Market Report 2016 analyses different countries approaches to energy efficiency, with five market snapshots presented – Australia, Germany, Spain, Sweden and the United States.
In Australia, the overarching national framework is the National Energy Productivity Plan (NEPP), which seeks to reduce costs for household and business energy consumers across both energy efficiency and energy markets. Despite the NEPP a national approach is relatively new in Australia with numerous states and territories having already implemented energy efficiency schemes.
The IEA’s report does not factor in the impact of Australia’s state and territory-based schemes, such as Victoria’s Energy Efficiency Target (VEET) scheme and New South Wales’ Energy Savings Scheme (ESS), on energy efficiency improvements. The report rather reflects the performance of mandated national initiatives in Australia.
It remains unclear how much of an impact Australia’s state and territory schemes are making. The national schemes, however, have encouraged improvements via labelling of household items, such as refrigerators, rather than subsidising household improvements, such as lighting, which some state schemes are currently doing. These certificate-based schemes were originally promoted to reduce emissions and save consumers money, but are delivering items readily available on the market and have introduced additional costs to all energy consumers.
A global look
The IEA’s Energy Efficiency Market Report 2016[ii] examines the role of energy efficiency in the global energy transition. The report highlights the progress made by energy efficiency policies around the world over the past year, particularly in China, and emerging technologies.
Global energy intensity improved by 1.8 per cent in 2015 and 1.5 per cent in 2014, which was triple the average improvement of 0.6 per cent between 2003 and 2013. Figure 1 shows the improvements. The avoided greenhouse gas (GHG) emissions totaled 1.5 billion tonnes of carbon dioxide, and also avoided over USD 1 trillion in investment in electricity generation, according to the IEA.[iii]
Figure 1: Changes in energy intensity from 2003-30
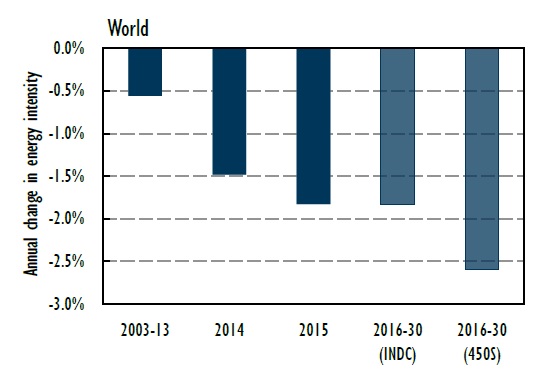
Source: International Energy Agency, “Energy Efficiency Market Report 2016”, 2016
The IEA report highlights that government policy is fundamental to improving energy efficiency through the growth of mandatory policies and the implementation of energy performance standards. The coverage of mandatory standards and regulations is roughly even among the transport, industry and buildings sector at a global level although sector coverage differs across countries. As Figure 1 shows, China and India make up the largest share of industry savings. The United States and the European Union industry share accounts for a smaller share than other sectors because there are fewer mandatory standards and targets in industry.
Figure 2: Energy use covered by mandatory energy efficiency standards for selected countries, 2015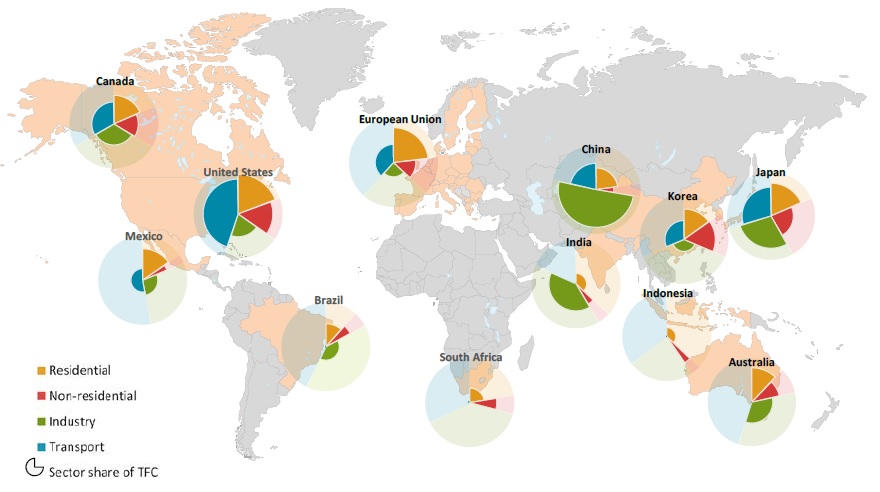
Source: International Energy Agency, 2016, “Energy Efficiency Market Report 2016”. Total final energy consumption (TFC) is the sum of consumption by all end-use sectors
Mandatory policies are not the only mechanisms that can improve energy efficiency but they have been one of the most widely used tools to improve efficiency by governments internationally. The IEA highlights that certain countries have implemented energy performance standards since the 1970s. Most have since expanded the number of end uses regulated (coverage) and reduced the allowable quantity of energy consumed to provide a given unit of service. The IEA report highlights that the growth of energy efficiency policies such as standards, in terms of both their range of coverage and the performance levels they require, is also having a material effect on energy demand.
From 1 July 2017, the NEPP in Australia will lower the threshold of the Commercial Building Disclosure program from 2,000 to 1,000 square meters (m2). In addition to helping inform buyers and tenants of building energy costs, Australia will also pursue significant energy savings on six priority product categories through the Equipment Energy Efficiency (E3) program, which seeks to improve energy efficiency standards and energy labelling for equipment and appliances. These include: lighting, non-domestic fans, swimming pool pumps, commercial refrigerated storage and display cabinets, air conditioning, and domestic refrigerators and freezers. The E3 program is expected to deliver more than $50 million in energy savings, and around 3.5 million tonnes of emission reductions over five years.
The IEA report also references Australia’s earlier labeling of refrigerators that improved efficiency of refrigerators by 18 per cent between 1986 and 1999. Refrigerators and freezers have been required to display an energy label since 1986 and to meet minimum energy efficiency levels since 1999. After the first efficiency standard for refrigerators was introduced in 1999, efficiency improved by 40 per cent to 2010 at an average annual rate of 4.5 per cent. Refrigerators are now 70 per cent more efficient than they were 30 years ago.[iv]
In October 2012, the Greenhouse and Minimum Standards (GEMS) Act came into effect in Australia, creating a national framework for product energy efficiency.
Figure 3: Energy efficiency of refrigerator capacity in Australia and policy developments, 1970-2020
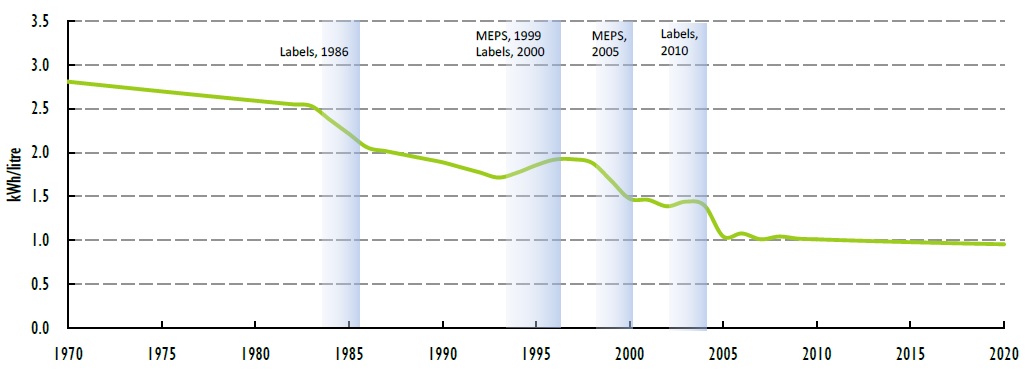
Source: International Energy Agency, “Energy Efficiency Market Report 2016”, 2016
Australia’s government standards and schemes require improved energy efficiency for appliances and homes. Consumers can then be guided by energy star ratings when purchasing a new household item.
The limitations in the IEA report are that it looks at predominately mandated, national initiatives in Australia and notes that it does not factor in state and territory-based schemes. To get a full reflection of the impact of energy efficiency initiatives in Australia requires an understanding of the impact of the state and territory-based schemes.
State schemes in Australia
As noted above, Australia’s national schemes have helped drive change and improved efficiency standards in major household products. Across Australia, however, there have been numerous additional schemes implemented across jurisdictions. These white schemes were initially designed to find the cheapest initiatives and were originally sold as dealing with market failures that would help reduce emissions and save consumers money.
All schemes offer a broad range of activities, but unsurprisingly energy efficiency businesses, have pursued the most straight forward and lowest cost options. In Australia, energy efficiency schemes have predominantly focused on lighting and stand-by power controllers (SPC). Once such options are exhausted it is likely to become increasingly expensive to deliver the same level of certificates and efficiency benefits. Recent statistics from the NSW Energy Savings Scheme show that over 62 per cent of the certificates created in 2015 went to lighting.[v]
Figure 4: Number of certificates created, by project type in NSW
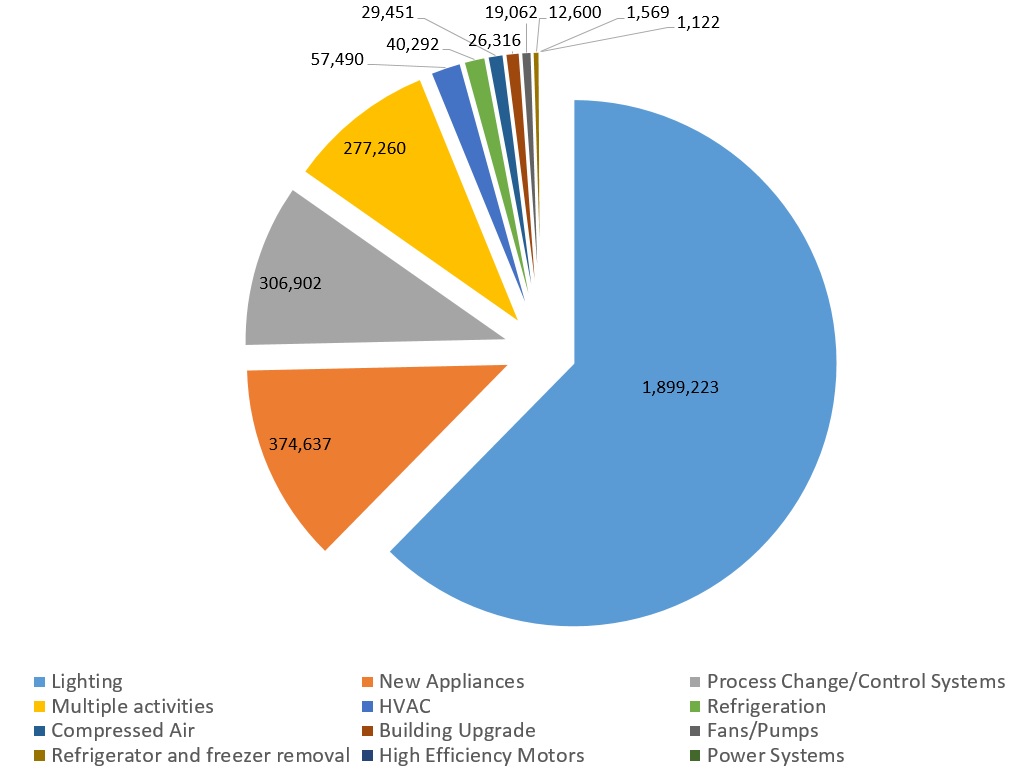
Source: Independent Pricing and Regulatory Tribunal (IPART), “NSW Energy Savings Scheme - Compliance and Operation in 2015 - Annual Report to the Minister”, 2016
Most of the state schemes were enacted while overall electricity consumption was still rising, partly justified on the basis they would help avoid the cost of new electricity generation plant.
According to recently released ABS statistics, since 2002-2003, energy use per capita has decreased by 5 per cent and per household by 7 per cent. Although as the ABS highlights, increased energy efficiency of household appliances is only one component of many that are contributing to the fall. Energy use per household is also affected by economic (increases in energy costs), technological (increase in take up of photovoltaic (PV) and thermal solar energy generation) and energy conservation measures (insulation and energy audits).
[i] International Energy Agency, 2016, “Energy Efficiency Market Report 2016”
[ii] ibid
[iii] ibid
[iv] http://www.energyrating.gov.au/products/domestic-refrigeration
[v] Independent Pricing and Regulatory Tribunal (IPART), 2016, “NSW Energy Savings Scheme - Compliance and Operation in 2015 - Annual Report to the Minister”
Related Analysis
The ‘f’ word that’s critical to ensuring a successful global energy transition
You might not be aware but there’s a new ‘f’ word being floated in the energy industry. Ok, maybe it’s not that new, but it is becoming increasingly important as the world transitions to a low emissions energy system. That word is flexibility. The concept of flexibility came up time and time again at the recent International Electricity Summit held in in Sendai, Japan, which considered how the energy transition is being navigated globally. Read more
Nuclear Fusion Deals – Based on reality or a dream?
Last week, Italian energy company ENI announced a $1 billion (USD) purchase of electricity from U.S.-based Commonwealth Fusion Systems (CFS), described as the world’s leading commercial fusion energy company and backed by Bill Gates’ Breakthrough Energy Ventures. CFS plans to start building its Arc facility in 2027–28, targeting electricity supply to the grid in the early 2030s. Earlier this year, Google also signed a commercial agreement with CFS. These are considered the world’s first commercial fusion-power deals. While they offer optimism for fusion as a clean, abundant energy source, they also recall decades of “breakthrough” announcements that have yet to deliver practical, grid-ready power. The key question remains: how close is fusion to being not only proven, but scalable and commercially viable, and which projects worldwide are shaping its future?
Community Power Network Trial: Potential risks and market impact
Australia leads the world in rooftop solar, yet renters, apartment dwellers and low-income households remain excluded from many of the benefits. Ausgrid’s proposed Community Power Network trial seeks to address this gap by installing and operating shared solar and batteries, with returns redistributed to local customers. While the model could broaden access, it also challenges the long-standing separation between monopoly networks and contestable markets, raising questions about precedent, competitive neutrality, cross-subsidies, and the potential for market distortion. We take a look at the trial’s design, its domestic and international precedents, associated risks and considerations, and the broader implications for the energy market.
Send an email with your question or comment, and include your name and a short message and we'll get back to you shortly.